
- LIVE QUOTES
- LEARN
- HELP
 Nasdaq
 Wall Street Journal
EN
Is Autodesk (ADSK) Now Attractive After A 21.5% Share Price Slide?
What Autodesk’s Recent Share Price Moves Might Mean For Value Focused Investors
Before you decide whether Autodesk might be attractively priced, it helps to step back and ask what the recent share price is really telling you about expectations baked into the stock.
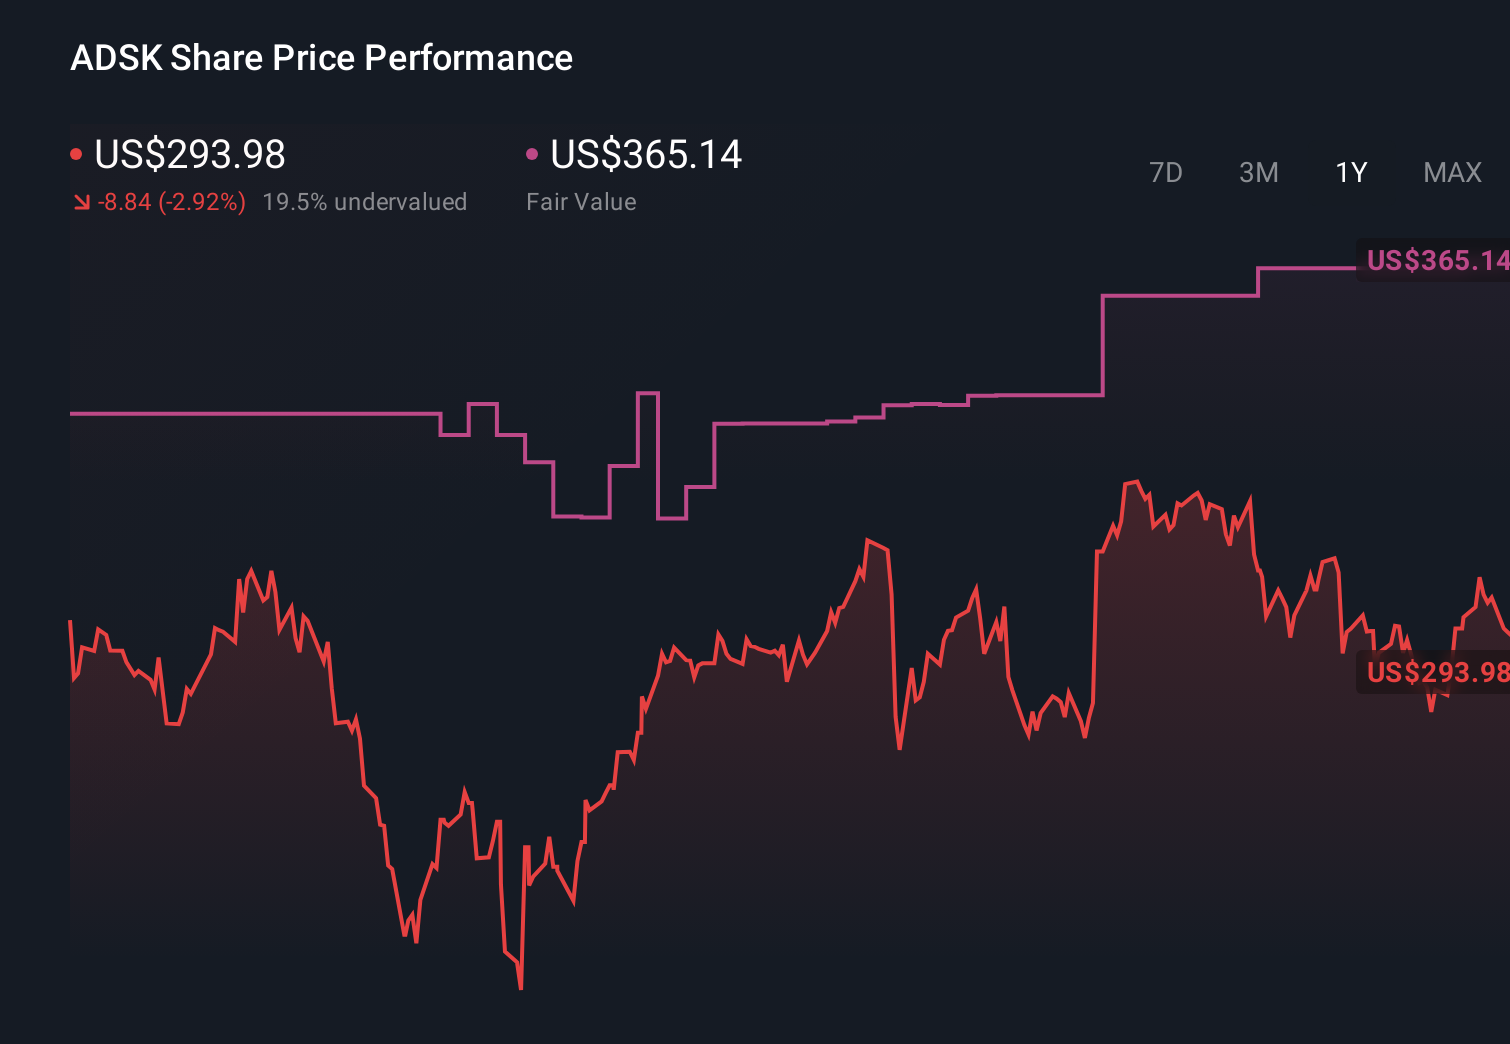
Over the last week the share price has fallen 10.2%, contributing to a 16.0% decline over the past month and a 21.5% decline over the past year, even though the 3 year return sits at 7.7% and the 5 year return at 20.9%.
Recent coverage around Autodesk has focused on its role as a core software provider for design and engineering workflows, as well as ongoing attention from investors who are watching how broader software sector sentiment affects established names. This context helps explain why the stock can see sharp moves when investor risk appetite for software names changes, even without company specific catalysts being in the headlines.
Against that backdrop, Autodesk currently scores 3 out of 6 on our valuation checks. You can see this in detail on our valuation scorecard. Next we will walk through the standard valuation methods behind that number before finishing with a more holistic way to think about what the market might be pricing in.
Find out why Autodesk's -21.5% return over the last year is lagging behind its peers.
Approach 1: Autodesk Discounted Cash Flow (DCF) Analysis
A Discounted Cash Flow model takes projected future cash flows, then discounts them back to today using a required rate of return to estimate what the business might be worth right now.
For Autodesk, the model used is a 2 Stage Free Cash Flow to Equity framework, based on cash flow projections in $. The latest twelve month free cash flow is about $2.07b. Analyst and extrapolated estimates suggest free cash flow of $3.71b in 2030, with intermediate annual projections between 2026 and 2035 that Simply Wall St has discounted back to present value.
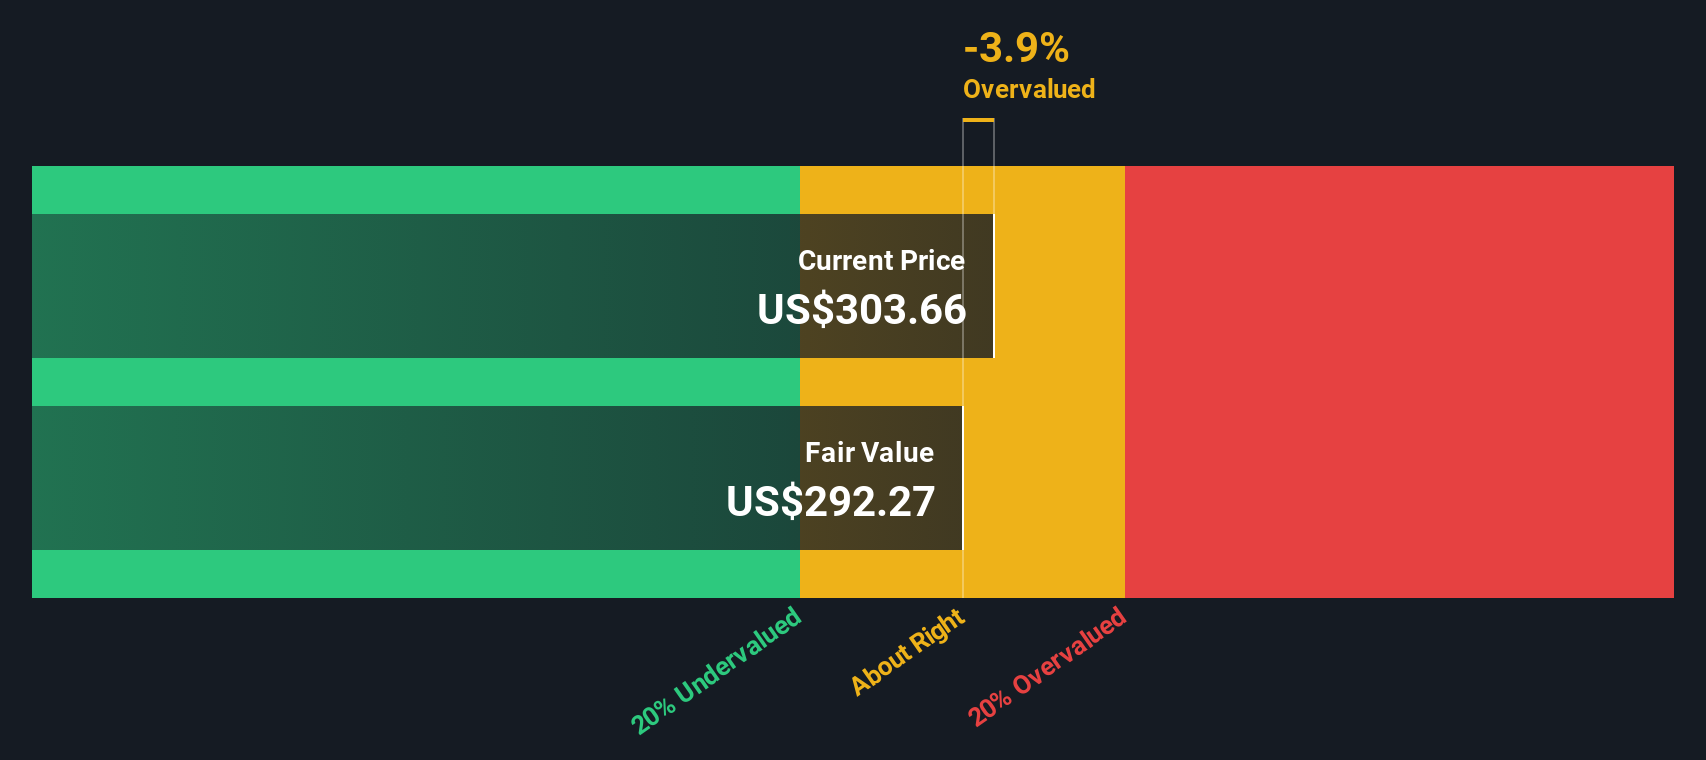
When those projected cash flows are added up and discounted, the model produces an estimated intrinsic value of $315.28 per share. Compared with the current market price, this implies the stock is trading at a 23.6% discount, so on this model Autodesk screens as undervalued.
Result: UNDERVALUED
Our Discounted Cash Flow (DCF) analysis suggests Autodesk is undervalued by 23.6%. Track this in your watchlist or portfolio, or discover 873 more undervalued stocks based on cash flows.
Approach 2: Autodesk Price vs Earnings
For profitable companies like Autodesk, the P/E ratio is a common way to gauge what investors are currently willing to pay for each dollar of earnings. It folds a lot of expectations into a single number, including how steady those earnings might be.
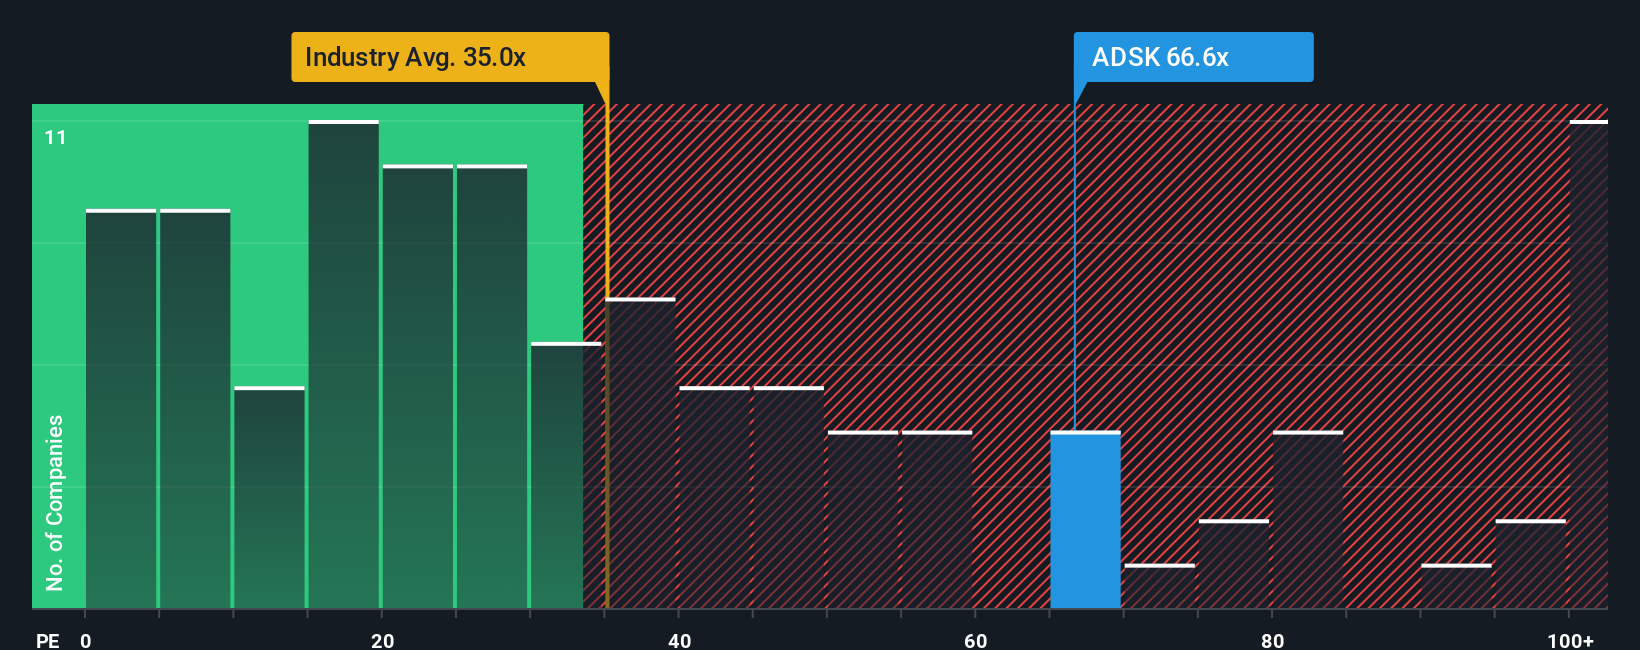
In simple terms, higher growth expectations and lower perceived risk can justify a higher P/E. Slower growth or higher risk usually call for a lower, more cautious P/E. Autodesk currently trades on a P/E of 45.86x. That is above both the Software industry average P/E of 27.69x and the peer group average of 35.93x, which suggests the market is applying a richer earnings multiple than these broad benchmarks.
Simply Wall St’s Fair Ratio for Autodesk is 35.31x. This is a proprietary estimate of what a reasonable P/E could be after accounting for factors like earnings growth, risk profile, profit margins, industry, and market cap, rather than just comparing against broad sector or peer averages. Since Autodesk’s actual P/E of 45.86x sits above this Fair Ratio, the shares look expensive on this metric right now.
Result: OVERVALUED
P/E ratios tell one story, but what if the real opportunity lies elsewhere? Discover 1426 companies where insiders are betting big on explosive growth.
Upgrade Your Decision Making: Choose your Autodesk Narrative
Earlier we mentioned that there is an even better way to understand valuation, so let us introduce you to Narratives. These are simply your own story about Autodesk, tied directly to your assumptions for future revenue, earnings, margins and what you think a fair value should be.
On Simply Wall St, Narratives live in the Community page and give you a clear link from the company’s story, to a forecast, to an estimated fair value. This allows you to quickly compare that fair value with the current price and decide whether Autodesk looks attractive, fully priced, or stretched based on your view.
Narratives update automatically when fresh information like earnings releases or major news arrives, so the story and the numbers stay in sync without you rebuilding a model each time.
For Autodesk, one investor might build a Narrative that supports a higher fair value based on a more optimistic long term outlook for design software. Another might set a lower fair value using more cautious revenue growth and margin assumptions, and both views sit side by side on the platform for you to compare.
Do you think there's more to the story for Autodesk? Head over to our Community to see what others are saying!
This article by Simply Wall St is general in nature. We provide commentary based on historical data and analyst forecasts only using an unbiased methodology and our articles are not intended to be financial advice. It does not constitute a recommendation to buy or sell any stock, and does not take account of your objectives, or your financial situation. We aim to bring you long-term focused analysis driven by fundamental data. Note that our analysis may not factor in the latest price-sensitive company announcements or qualitative material. Simply Wall St has no position in any stocks mentioned.
Have feedback on this article? Concerned about the content? Get in touch with us directly. Alternatively, email editorial-team@simplywallst.com