
- LIVE QUOTES
- LEARN
- HELP
 Nasdaq
 Wall Street Journal
EN
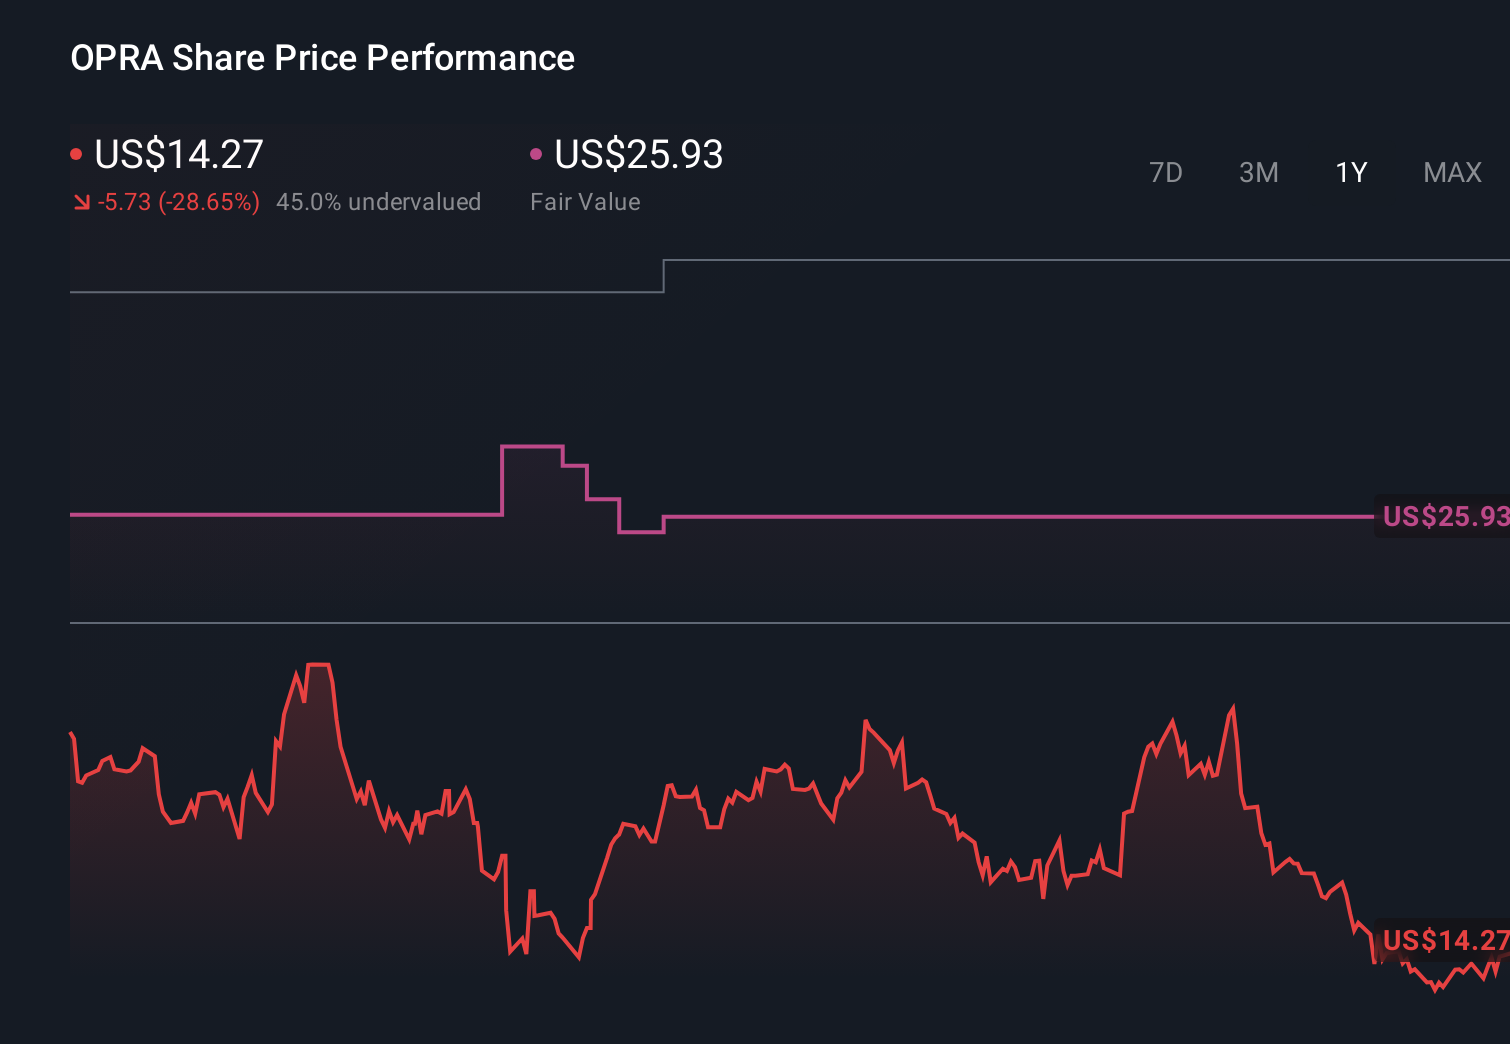
Is Opera (OPRA) Offering An Opportunity After The Recent Share Price Pullback
- Wondering whether Opera's share price reflects its real worth, or if the market is missing something important about the business? You are looking at the right company for a valuation checkup.
- The stock closed at US$13.19, with a 4.7% decline over the last 7 days, a 7.3% decline over the last 30 days, a 7.3% decline year to date, a 23.2% decline over 1 year, but a 133.7% gain over 3 years and a 73.6% gain over 5 years.
- These mixed returns have kept Opera on the radar for investors who focus on price moves over different timeframes. Recent coverage has largely centered on how the stock's multi year gains sit alongside the more recent pullback, which is why a clear view on value matters.
- On Simply Wall St's valuation checks Opera scores a full 6 out of 6. Next we will look at the standard valuation methods behind that score before finishing with a more complete way to think about what the market is really pricing in.
Find out why Opera's -23.2% return over the last year is lagging behind its peers.
Approach 1: Opera Discounted Cash Flow (DCF) Analysis
A Discounted Cash Flow, or DCF, model looks at the cash Opera is expected to generate in the future and discounts those cash flows back to today to estimate what the business could be worth now.
For Opera, Simply Wall St uses a 2 Stage Free Cash Flow to Equity model based on cash flow projections. The latest twelve month free cash flow is about $78.1 million. Analyst estimates and subsequent extrapolations have free cash flow projections, with the 2030 figure at $231.3 million, all in $. The ten year path uses analyst inputs for the earlier years and then extends those projections using modelled growth rates.
Bringing all those forecast cash flows back to today, the model arrives at an estimated intrinsic value of about $53.19 per share. Compared to the recent share price of $13.19, this DCF output implies the stock is 75.2% undervalued according to this set of assumptions and inputs.
Result: UNDERVALUED
Our Discounted Cash Flow (DCF) analysis suggests Opera is undervalued by 75.2%. Track this in your watchlist or portfolio, or discover 878 more undervalued stocks based on cash flows.

Approach 2: Opera Price vs Earnings
For a profitable company, the P/E ratio is a straightforward way to think about what you are paying for each dollar of current earnings. This is why it is a commonly used yardstick for stocks like Opera.
What counts as a "normal" P/E really comes down to how the market views a company’s growth potential and risk. Higher expected growth or lower perceived risk can support a higher multiple. Lower growth expectations or higher risk usually justify a lower one.
Opera currently trades on a P/E of 14.6x. That is below the Software industry average of 27.7x and the peer group average of 25.4x, so on simple comparisons the stock sits at a lower earnings multiple than many similar companies.
Simply Wall St’s Fair Ratio for Opera is 26.8x. This is a proprietary estimate of the P/E that might be appropriate given Opera’s earnings growth profile, industry, profit margins, market cap and key risks. Because it folds these factors into a single number, the Fair Ratio aims to give you a more tailored view than a basic peer or industry comparison.
With the current P/E at 14.6x versus a Fair Ratio of 26.8x, Opera screens as undervalued on this metric.
Result: UNDERVALUED

P/E ratios tell one story, but what if the real opportunity lies elsewhere? Discover 1425 companies where insiders are betting big on explosive growth.
Upgrade Your Decision Making: Choose your Opera Narrative
Earlier we mentioned that there is an even better way to understand valuation, so let us introduce you to Narratives, a simple way to connect your view of Opera’s story with the numbers behind it.
A Narrative is your own statement of what you think Opera is doing, how its business might develop, and what that could mean for future revenue, earnings and margins, tied directly to a fair value estimate that reflects those assumptions.
On Simply Wall St, Narratives on the Community page help you link Opera’s story to a forecast and then to a fair value, so you can compare that value to the current share price and decide whether you see it as an opportunity to buy, hold, or sell.
Because Narratives on the platform update when new information such as news or earnings is added, your view of Opera’s value can adjust quickly, and you can see how different investors, from the most optimistic to the most cautious, arrive at very different fair values for the same stock.
Do you think there's more to the story for Opera? Head over to our Community to see what others are saying!
This article by Simply Wall St is general in nature. We provide commentary based on historical data and analyst forecasts only using an unbiased methodology and our articles are not intended to be financial advice. It does not constitute a recommendation to buy or sell any stock, and does not take account of your objectives, or your financial situation. We aim to bring you long-term focused analysis driven by fundamental data. Note that our analysis may not factor in the latest price-sensitive company announcements or qualitative material. Simply Wall St has no position in any stocks mentioned.
Have feedback on this article? Concerned about the content? Get in touch with us directly. Alternatively, email editorial-team@simplywallst.com