
- LIVE QUOTES
- LEARN
- HELP
 Nasdaq
 Wall Street Journal
EN
Has Argan (AGX) Run Too Far After 8x Three Year Surge In Share Price?
- If you are wondering whether Argan's share price still lines up with its fundamentals, the valuation story is where things start to get interesting.
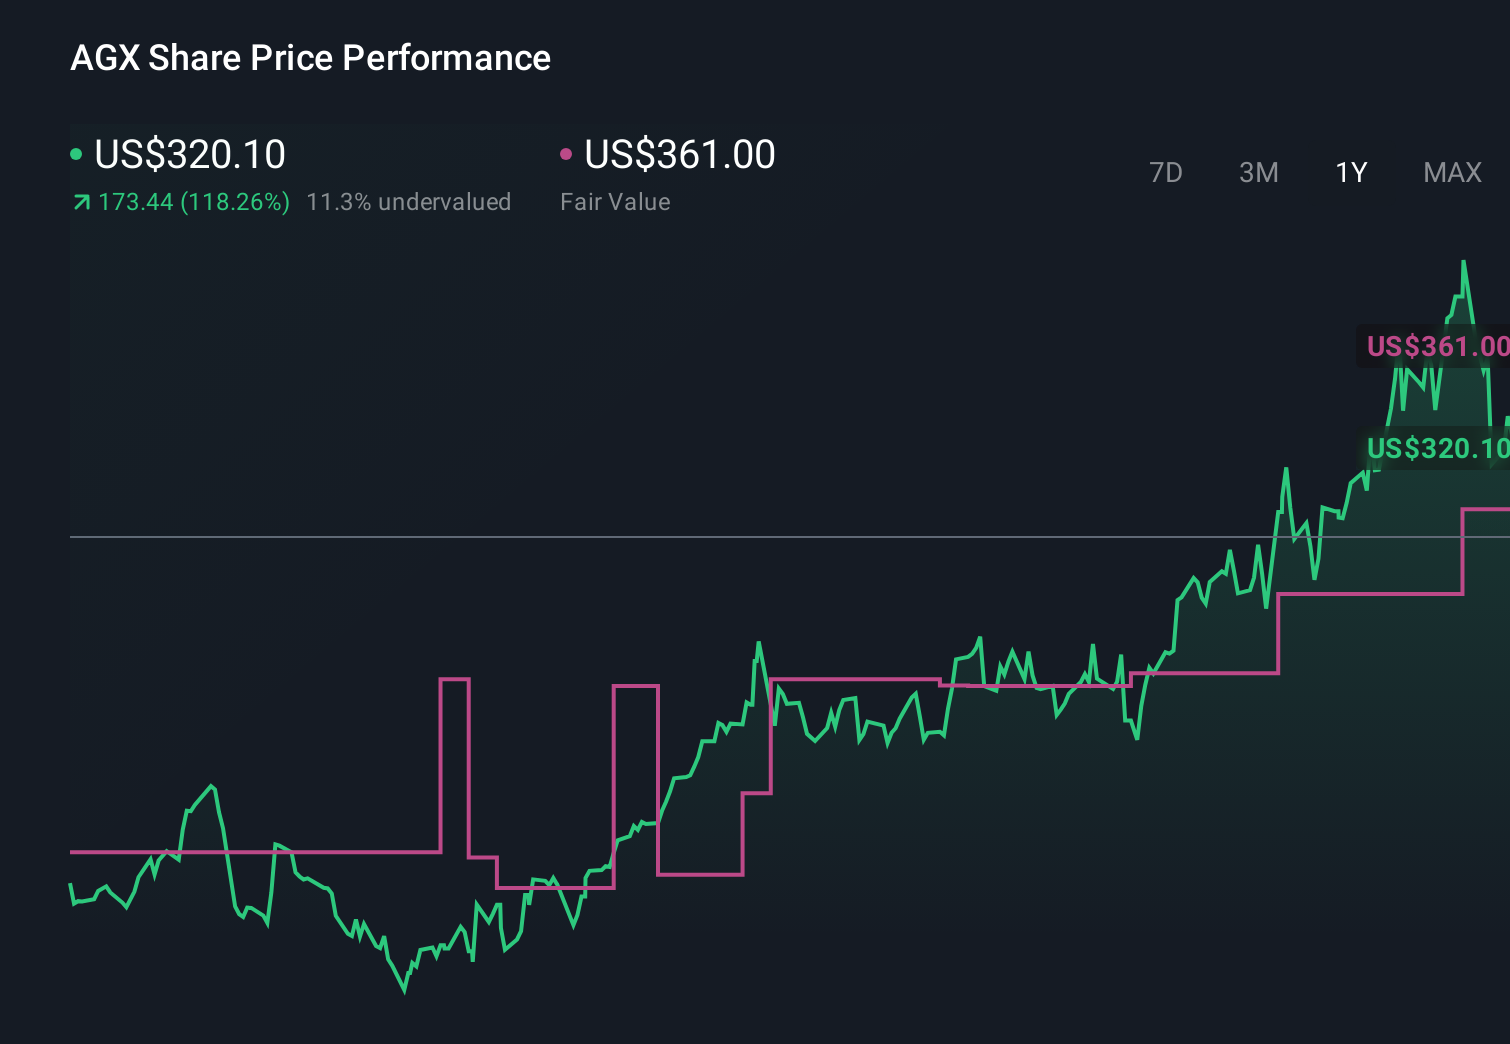
- At a last close of US$355.77, Argan's stock has returns of 0.6% over 7 days, 9.1% over 30 days, 9.1% year to date, 168.2% over 1 year and a very large 3 year return that is a little over 8x, with a 5 year return also very large.
- These moves sit against a backdrop of ongoing interest in Argan as an engineering and construction contractor for large capital projects, and continued attention on how companies in this space are positioned for new contract opportunities and project execution risk. Together, those themes help frame why investors are watching the stock's valuation so closely.
- Despite the strong share price history, Argan currently has a valuation score of 0/6, and next we will look at how different valuation approaches arrive at that score, before finishing with a way of thinking about value that can give you a fuller picture than the usual metrics alone.
Argan scores just 0/6 on our valuation checks. See what other red flags we found in the full valuation breakdown.
Approach 1: Argan Discounted Cash Flow (DCF) Analysis
A Discounted Cash Flow, or DCF, model estimates what a business might be worth by projecting its future cash flows and then discounting those back to today’s value. For Argan, the model used is a 2 Stage Free Cash Flow to Equity approach based on cash flow projections.
Argan’s latest twelve month free cash flow is reported at about $281.8 million, and analyst based projections plus extrapolations run through to 2035. For example, projected free cash flow sits in a range around $268.8 million in 2026 and $157.2 million in 2035, with interim years such as 2027 to 2034 also modeled using a mix of analyst estimates and trend based extensions from Simply Wall St.
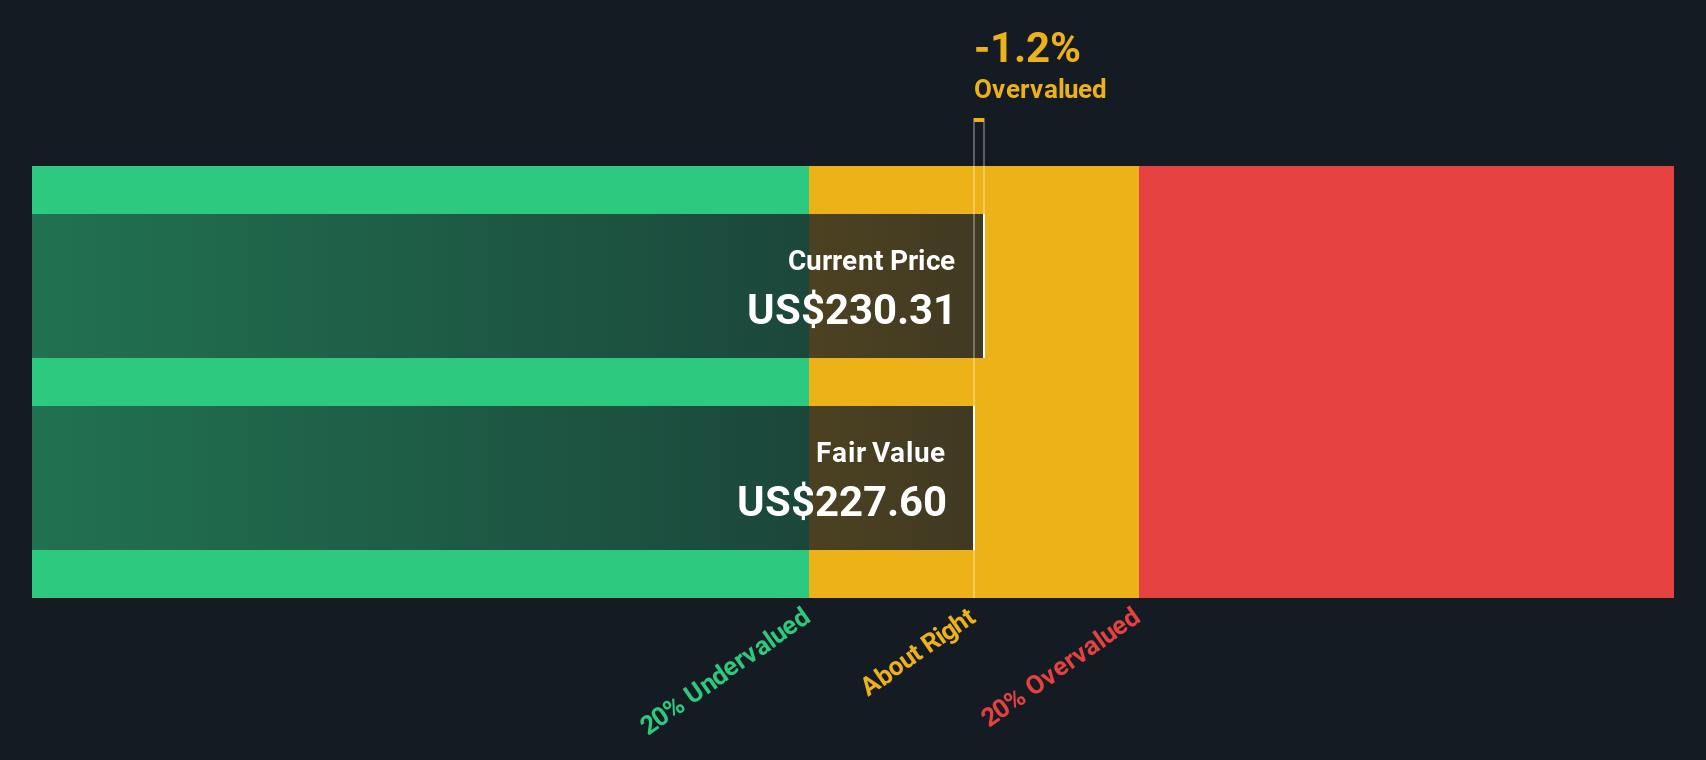
When all of those projected cash flows are discounted back and summed, the model arrives at an estimated intrinsic value of about $181.12 per share. Compared with the recent share price of US$355.77, the DCF output suggests Argan is around 96.4% overvalued on this specific cash flow based view.
Result: OVERVALUED
Our Discounted Cash Flow (DCF) analysis suggests Argan may be overvalued by 96.4%. Discover 871 undervalued stocks or create your own screener to find better value opportunities.
Approach 2: Argan Price vs Earnings
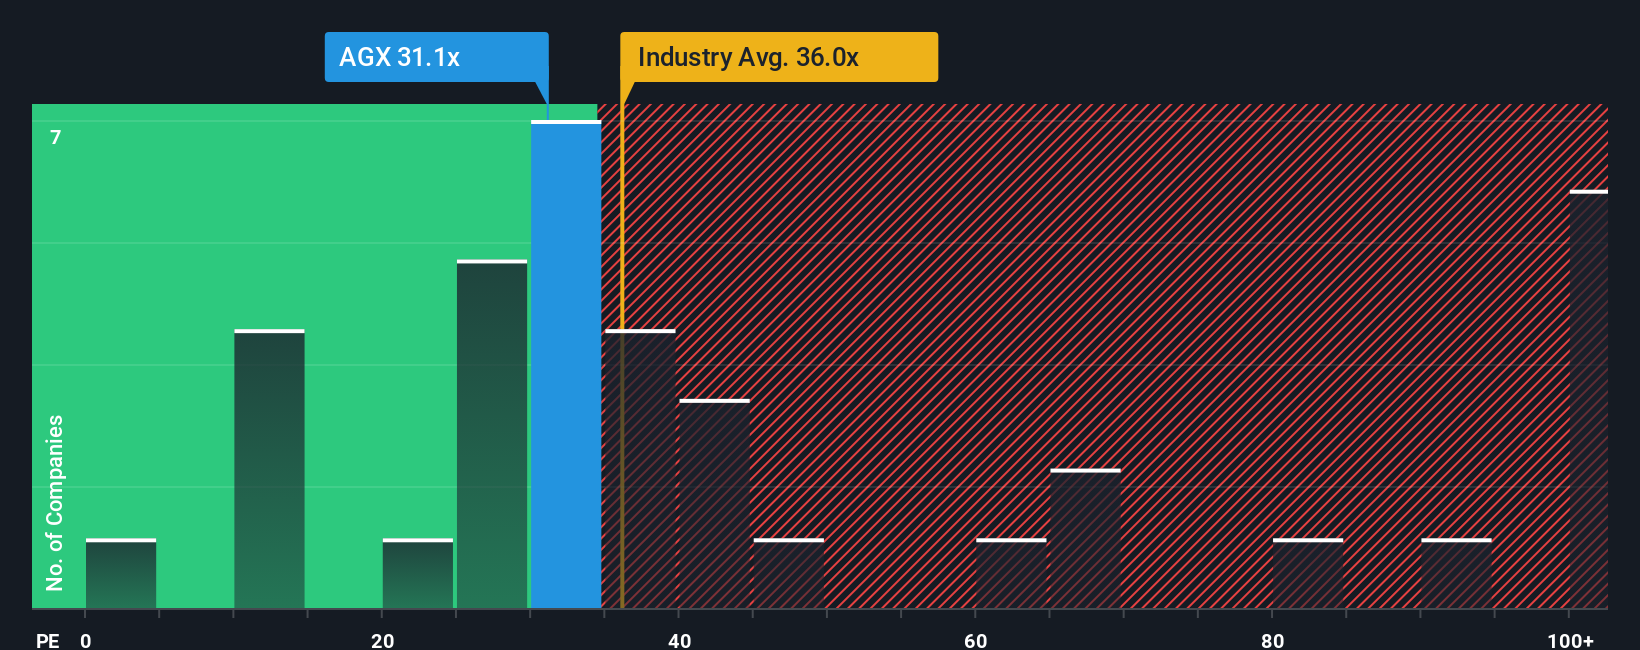
For a profitable company like Argan, the P/E ratio is a useful way to relate what you pay per share to the earnings the business is currently generating. Investors usually accept a higher P/E when they expect stronger growth or see lower risk, and a lower P/E when growth expectations are more muted or risks are higher.
Argan currently trades on a P/E of 41.15x. That sits above the Construction industry average P/E of 35.80x and also above the peer group average of 39.25x. Simply Wall St goes a step further with its proprietary “Fair Ratio”, which estimates what a more company specific P/E might look like once factors such as earnings growth, industry, profit margins, market cap and identified risks are taken into account.
Because the Fair Ratio is tailored to Argan rather than based on broad groupings, it can offer a more focused reference point than simple comparisons with peers or the overall industry. For Argan, the Fair Ratio comes out at 34.83x, which is below the current 41.15x, suggesting the shares trade above this model based estimate of a fair earnings multiple.
Result: OVERVALUED
P/E ratios tell one story, but what if the real opportunity lies elsewhere? Discover 1423 companies where insiders are betting big on explosive growth.
Upgrade Your Decision Making: Choose your Argan Narrative
Earlier we mentioned that there is an even better way to understand valuation, so let us introduce you to Narratives, which are simply the stories investors tell about a company that link their view of its business to a financial forecast and then to a fair value estimate.
On Simply Wall St, Narratives let you set out your assumptions for Argan’s future revenue, earnings and margins, and the platform turns that story into a forecast and a fair value you can compare with the current share price to decide whether the stock looks expensive or cheap to you.
You will find Narratives on the Community page, where millions of investors share these story plus numbers combinations. Each Narrative automatically refreshes when new information such as earnings reports or company news is added to the platform, so your fair value view stays aligned with the latest data.
For example, one Argan Narrative might assume a relatively cautious revenue outlook and arrive at a lower fair value. Another might build in stronger contract wins and produce a much higher fair value. Seeing that range helps you decide which story you find more reasonable and how that lines up with today’s price.
Do you think there's more to the story for Argan? Head over to our Community to see what others are saying!
This article by Simply Wall St is general in nature. We provide commentary based on historical data and analyst forecasts only using an unbiased methodology and our articles are not intended to be financial advice. It does not constitute a recommendation to buy or sell any stock, and does not take account of your objectives, or your financial situation. We aim to bring you long-term focused analysis driven by fundamental data. Note that our analysis may not factor in the latest price-sensitive company announcements or qualitative material. Simply Wall St has no position in any stocks mentioned.
Have feedback on this article? Concerned about the content? Get in touch with us directly. Alternatively, email editorial-team@simplywallst.com