
- LIVE QUOTES
- LEARN
- HELP
 Nasdaq
 Wall Street Journal
EN
Is Virgin Galactic (SPCE) Pricing In Too Much Pessimism After Its 40% One-Year Slide
- Wondering whether Virgin Galactic Holdings at US$2.85 is a bargain or a value trap? This article walks through what the current price may be implying about the stock.
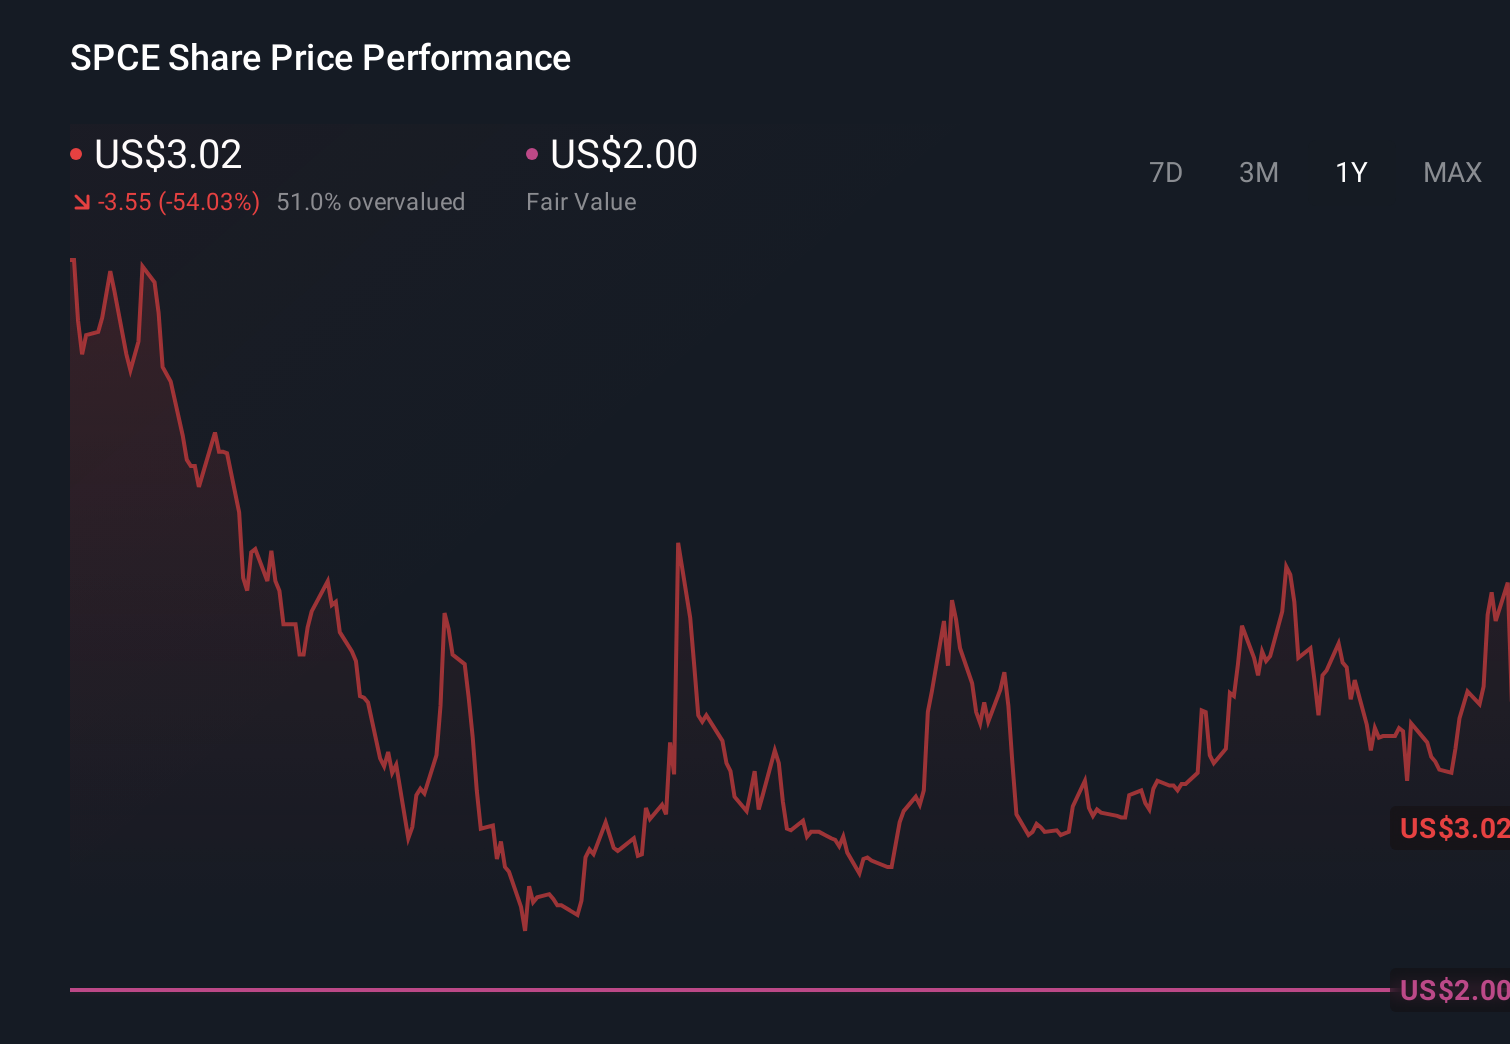
- The share price has seen steep declines, with returns of 7.2% over 7 days, 11.2% over 30 days, 13.4% year to date and 40.1% over 1 year, and an even larger 3 year and 5 year pullback of 97.7% and 99.7% respectively.
- These moves sit against a backdrop of ongoing attention on the commercial space tourism theme, including frequent discussion around Virgin Galactic's business model, funding needs and the pace of progress toward more regular flights. Investor focus has often been on whether the company can reach a scale where its capital spending, operating costs and demand profile line up in a way that supports the current market value.
- On our checks, Virgin Galactic scores 4 out of 6 on our valuation framework, and you can see the detailed scorecard here. Next we will walk through the key valuation approaches behind that score, then finish with a way to think about valuation that goes beyond any single model.
Approach 1: Virgin Galactic Holdings Discounted Cash Flow (DCF) Analysis
A Discounted Cash Flow model estimates what a company could be worth by projecting its future cash flows and then discounting those back to today using a required rate of return. It is essentially asking what future dollars are worth in today’s terms.
For Virgin Galactic Holdings, the latest twelve month free cash flow is a loss of $302.7 million. Analysts have provided detailed free cash flow estimates out to 2030, with 10 year projections ranging from a loss of $362.8 million in 2026 to positive $782.3 million in 2035. Beyond the initial analyst horizon, Simply Wall St extrapolates the cash flows to complete a 2 Stage Free Cash Flow to Equity model.
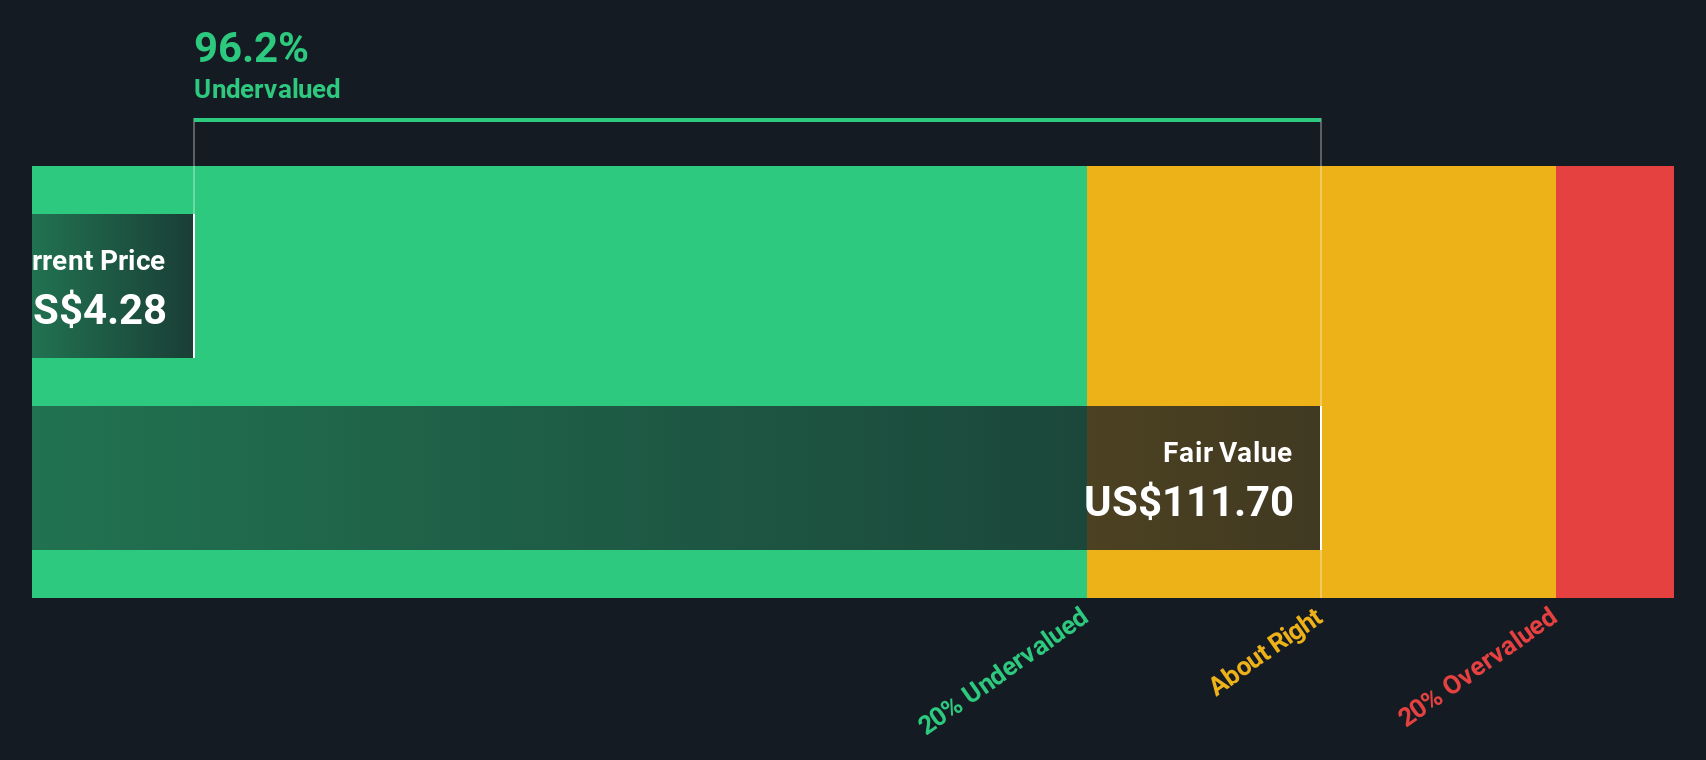
When all of those projected cash flows are discounted back to today, the model arrives at an estimated intrinsic value of $59.19 per share. Compared with the current share price of US$2.85, this implies the stock is 95.2% undervalued on this DCF view.
Result: UNDERVALUED
Our Discounted Cash Flow (DCF) analysis suggests Virgin Galactic Holdings is undervalued by 95.2%. Track this in your watchlist or portfolio, or discover 871 more undervalued stocks based on cash flows.
Approach 2: Virgin Galactic Holdings Price vs Book
For companies that are not yet generating consistent profits, price-based multiples tied to earnings can be hard to interpret, so investors often look at asset-based metrics like the P/B ratio instead. The idea is simple: you are comparing what the market is paying for each dollar of net assets on the balance sheet.
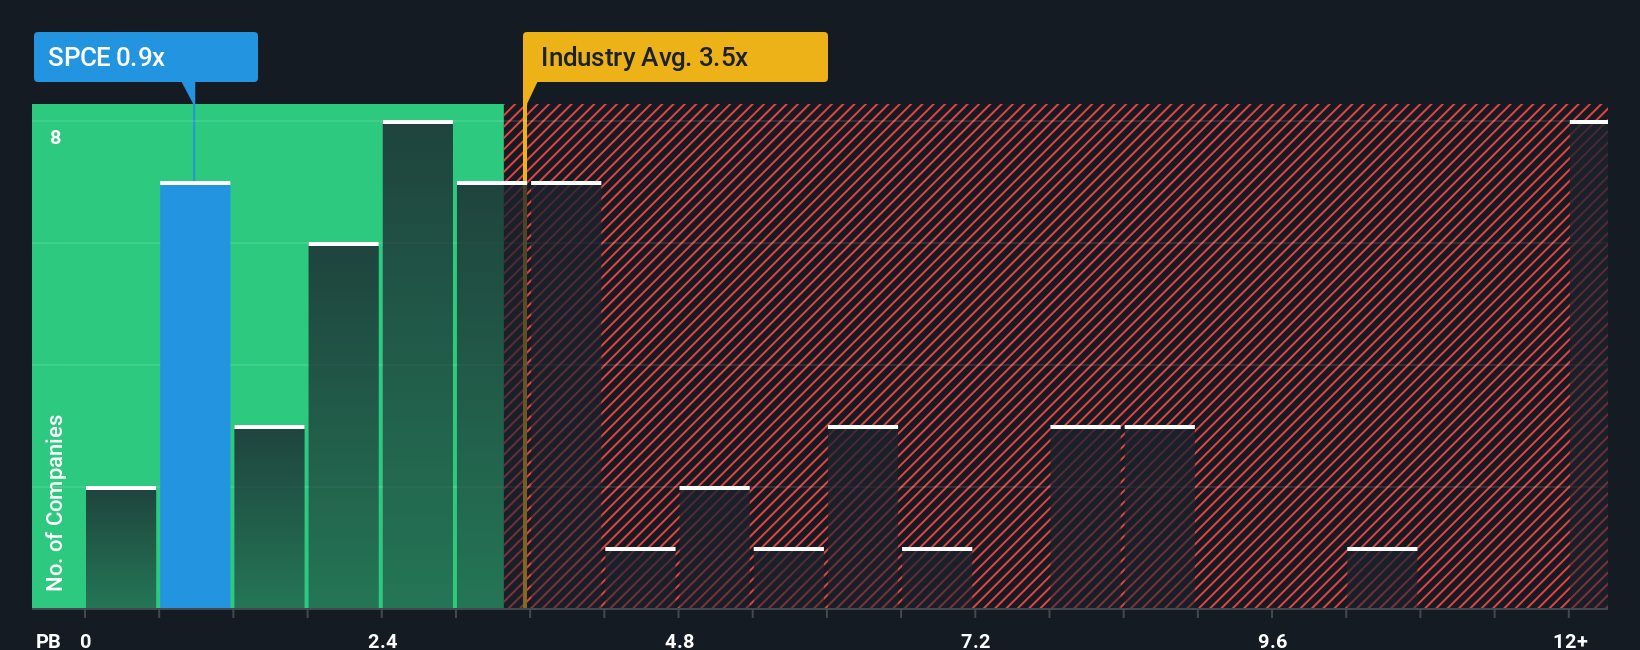
In general, higher growth expectations or lower perceived risk can justify a higher “normal” multiple, while slower growth or higher risk often lines up with a lower one. For Virgin Galactic, the current P/B is 0.92x. That sits below the Aerospace & Defense industry average of 4.23x and below the peer group average of 5.72x.
Simply Wall St’s Fair Ratio is designed to go a step further than these simple comparisons. It is a proprietary estimate of the preferred multiple that might make sense given factors like earnings growth, profit margins, industry, market cap and specific risks. Because it integrates these elements rather than just lining the company up against broad averages, it can give a more tailored view of what investors may be willing to pay. In this case, the actual 0.92x P/B is compared with the Fair Ratio to reach an overall judgment.
Result: ABOUT RIGHT
P/B ratios tell one story, but what if the real opportunity lies elsewhere? Discover 1420 companies where insiders are betting big on explosive growth.
Upgrade Your Decision Making: Choose your Virgin Galactic Holdings Narrative
Earlier we mentioned that there is an even better way to think about valuation, and that is Narratives, which let you attach a clear story to your numbers by spelling out your assumptions for Virgin Galactic Holdings’ future revenue, earnings, margins and the fair value that falls out of that view.
A Narrative ties three things together in one place: the company’s story, a financial forecast and the fair value those forecasts imply, which you can then compare with today’s share price to help decide whether you see more upside or downside.
On Simply Wall St’s Community page, used by millions of investors, Narratives are easy to set up and they automatically refresh when new information like earnings releases or news is added. This means your fair value view keeps moving with the story rather than staying frozen.
For Virgin Galactic Holdings, one investor might see a relatively low fair value if they assume cash flows stay close to recent levels with limited improvement. Another could set a much higher fair value if they expect the projected $782.3 million free cash flow in 2035 to be part of a longer period of strong performance.
Do you think there's more to the story for Virgin Galactic Holdings? Head over to our Community to see what others are saying!
This article by Simply Wall St is general in nature. We provide commentary based on historical data and analyst forecasts only using an unbiased methodology and our articles are not intended to be financial advice. It does not constitute a recommendation to buy or sell any stock, and does not take account of your objectives, or your financial situation. We aim to bring you long-term focused analysis driven by fundamental data. Note that our analysis may not factor in the latest price-sensitive company announcements or qualitative material. Simply Wall St has no position in any stocks mentioned.
Have feedback on this article? Concerned about the content? Get in touch with us directly. Alternatively, email editorial-team@simplywallst.com