
- LIVE QUOTES
- LEARN
- HELP
 Nasdaq
 Wall Street Journal
EN
Is Bancorp (TBBK) Still Attractive After Recent Pullback And Strong Multi Year Rally
- If you are wondering whether Bancorp at around US$59.44 is still good value after a strong multi year run, you are not alone.
- The stock has seen a 12.1% decline year to date, with shorter term moves of 11.5% over 7 days and 12.0% over 30 days, set against a 66.4% return over 3 years and 224.1% over 5 years.
- Recent news coverage has focused on Bancorp's position within the US banking sector and how investors are reassessing risk and growth expectations for regional financial institutions. This context helps explain why the share price has pulled back recently, even after strong longer term returns.
- Bancorp currently scores 5 out of 6 on our valuation checks for potential undervaluation, giving it a 5/6 valuation score. Next we will look at what different valuation approaches say about that number and why a deeper framework later in this article may give you an even clearer view of value.
Find out why Bancorp's -2.7% return over the last year is lagging behind its peers.
Approach 1: Bancorp Excess Returns Analysis
The Excess Returns model looks at how much profit a company is expected to earn above the return that shareholders require, then builds an intrinsic value estimate from that gap.
For Bancorp, the starting point is a Book Value of US$15.89 per share and a Stable EPS estimate of US$5.40 per share, based on the median return on equity from the past 5 years. The model uses an Average Return on Equity of 26.25% and a Cost of Equity of US$1.43 per share, which leads to an Excess Return of US$3.97 per share.
Analysts also point to a Stable Book Value of US$20.58 per share, based on weighted future Book Value estimates from 2 analysts. Putting these inputs together, the Excess Returns model produces an estimated intrinsic value of about US$128.04 per share for Bancorp.
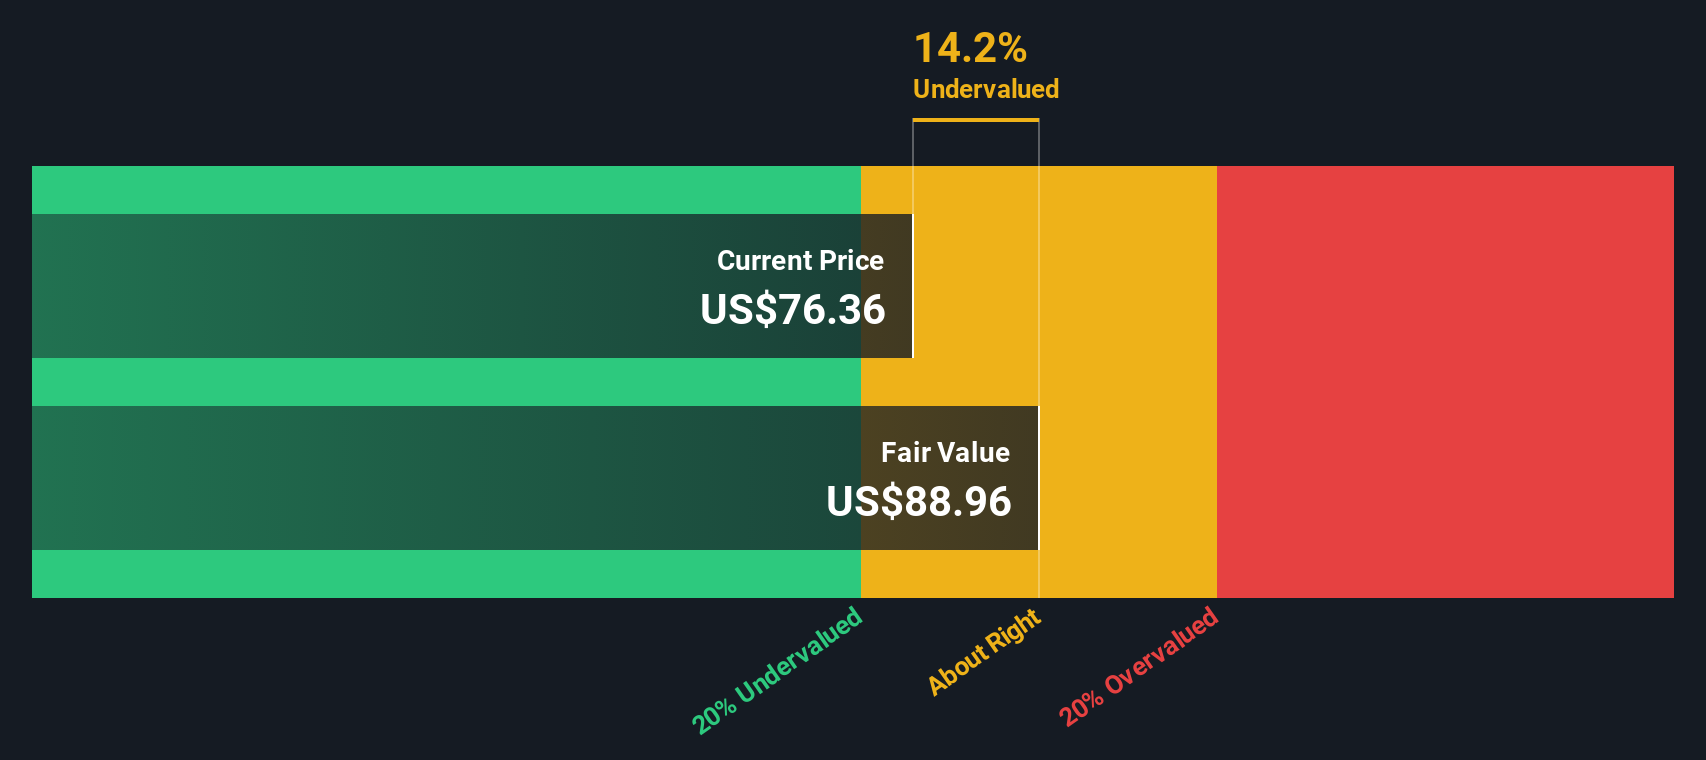
Compared with the current share price of around US$59.44, this implies the shares trade at roughly a 53.6% discount to the model’s intrinsic value, suggesting the stock screens as materially undervalued on this framework.
Result: UNDERVALUED
Our Excess Returns analysis suggests Bancorp is undervalued by 53.6%. Track this in your watchlist or portfolio, or discover 870 more undervalued stocks based on cash flows.
Approach 2: Bancorp Price vs Earnings
For a consistently profitable company, the P/E ratio is a straightforward way to think about value because it links what you pay per share to the earnings that each share is generating today.
What counts as a “normal” P/E often reflects how the market views a company’s growth prospects and risk. Higher growth and lower perceived risk can justify a higher multiple, while slower growth or higher risk usually point to a lower one.
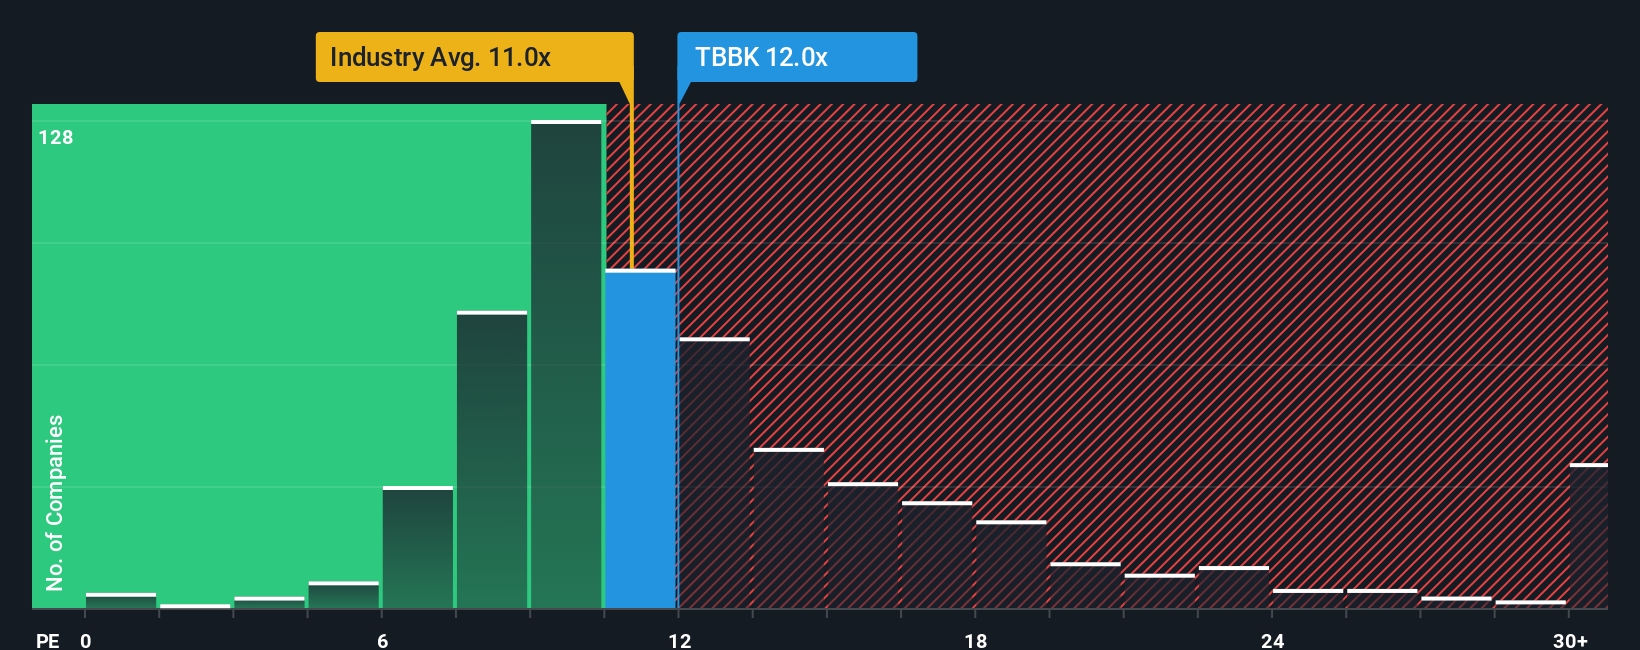
Bancorp currently trades on a P/E of 11.03x. That sits close to the Banks industry average of 11.84x and below the peer group average of 15.06x, so on a simple comparison the stock does not look expensive relative to similar companies.
Simply Wall St’s Fair Ratio is a proprietary estimate of what Bancorp’s P/E “should” be, given factors such as its earnings growth profile, profitability, risk characteristics, industry and market cap. This tailored view can be more useful than broad peer or industry comparisons, which often miss company specific strengths or weaknesses.
For Bancorp, the Fair Ratio is 15.99x versus the current 11.03x P/E, which suggests the shares are trading below this model-based estimate.
Result: UNDERVALUED
P/E ratios tell one story, but what if the real opportunity lies elsewhere? Discover 1419 companies where insiders are betting big on explosive growth.
Upgrade Your Decision Making: Choose your Bancorp Narrative
Earlier we mentioned that there is an even better way to understand valuation, so let us introduce you to Narratives, which let you tell a clear story about Bancorp using your own assumptions for fair value, future revenue, earnings and margins.
A Narrative connects three pieces: the story you believe about the business, the financial forecast that follows from that story, and the fair value that drops out of those numbers, so you can see exactly how your view translates into a price.
You can use Narratives directly on Simply Wall St’s Community page, where millions of investors share their views in a simple format that feels more like comparing stories than building a complex model.
This can make it easier to decide whether to buy or sell because you can line up your Fair Value against Bancorp’s current share price, then see how your conviction changes as new earnings or news automatically update the Narrative inputs in real time.
For example, one Bancorp Narrative might use very cautious revenue and margin assumptions and arrive at a Fair Value well below US$59.44, while another Narrative might assume stronger profitability and support a Fair Value closer to the Excess Returns estimate of about US$128.04 per share.
Do you think there's more to the story for Bancorp? Head over to our Community to see what others are saying!
This article by Simply Wall St is general in nature. We provide commentary based on historical data and analyst forecasts only using an unbiased methodology and our articles are not intended to be financial advice. It does not constitute a recommendation to buy or sell any stock, and does not take account of your objectives, or your financial situation. We aim to bring you long-term focused analysis driven by fundamental data. Note that our analysis may not factor in the latest price-sensitive company announcements or qualitative material. Simply Wall St has no position in any stocks mentioned.
Have feedback on this article? Concerned about the content? Get in touch with us directly. Alternatively, email editorial-team@simplywallst.com