
- LIVE QUOTES
- LEARN
- HELP


EN
Mechanics Bancorp (MCHB) Margin Strength With 166.5% Earnings Growth Tests Premium Valuation Narrative
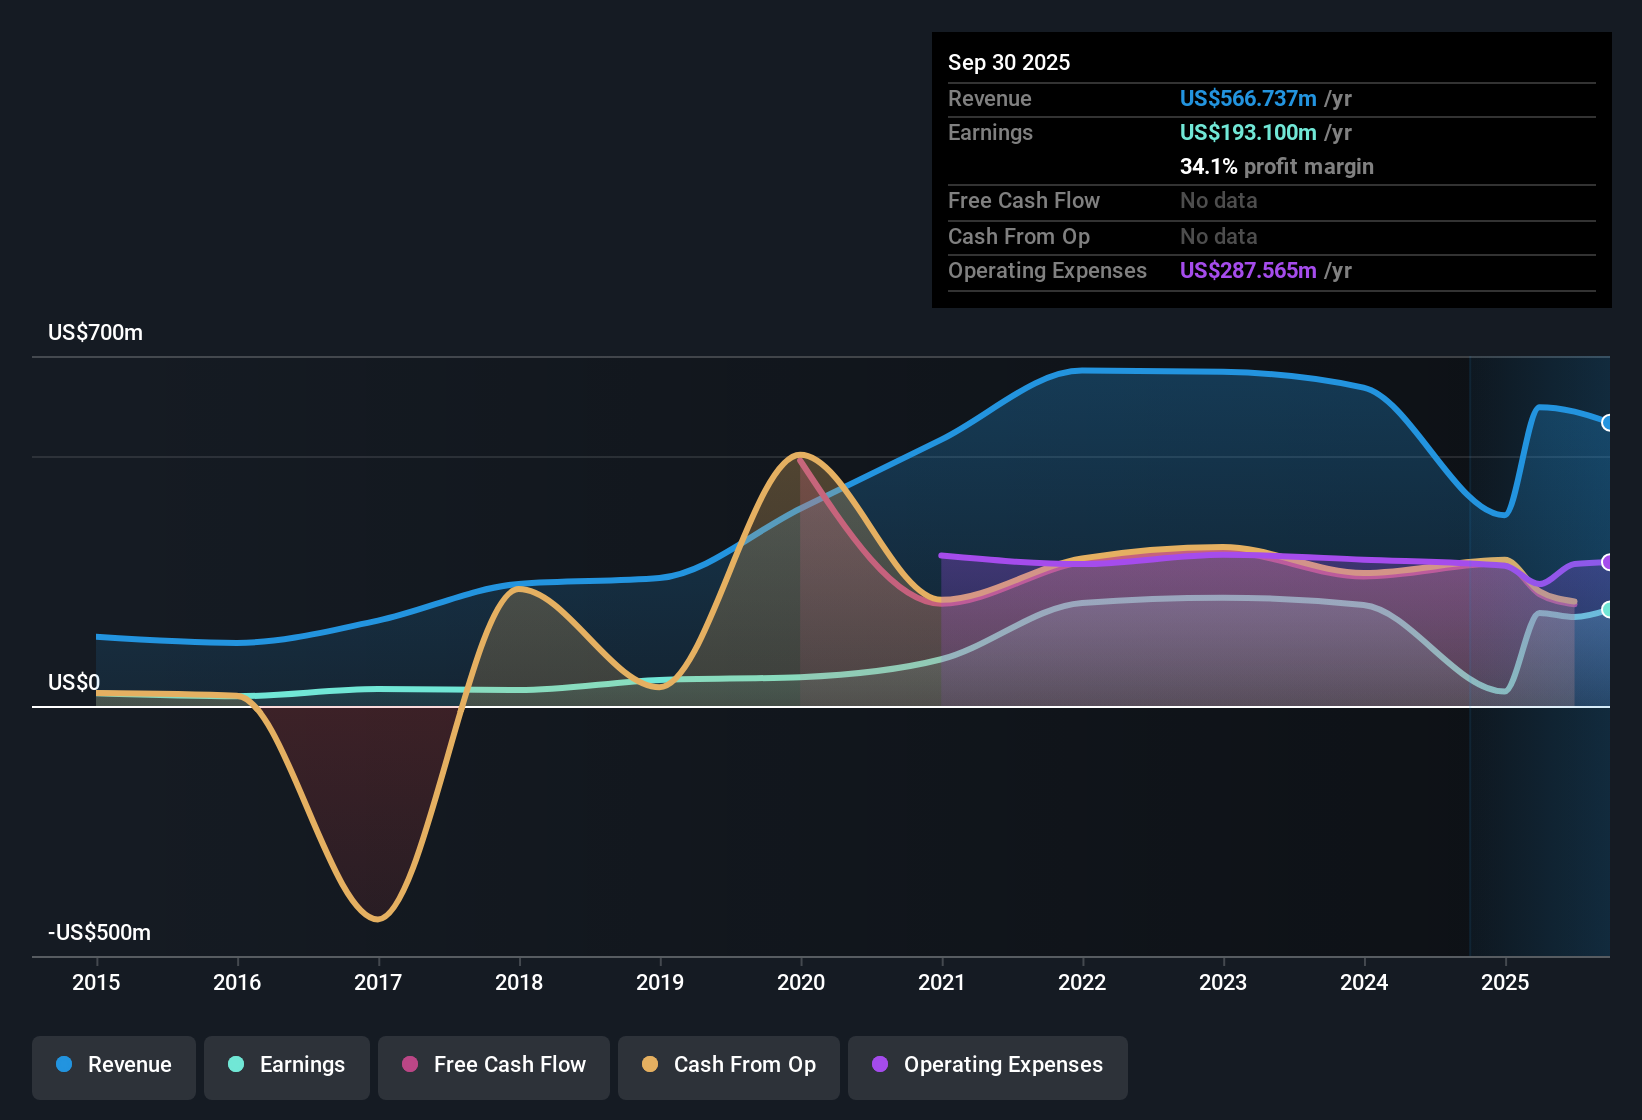
Mechanics Bancorp (MCHB) has just posted its FY 2025 third quarter scorecard, reporting total revenue of US$119.0 million and basic EPS of US$0.26, supported by net income of US$55.2 million. The company’s results show revenue moving from US$141.1 million and EPS of US$0.20 in Q3 FY 2024 to US$119.0 million and EPS of US$0.26 in Q3 FY 2025. Trailing twelve month EPS stands at US$0.90 on revenue of US$566.7 million. With a net profit margin now reported at 34.1% over the trailing year, this set of results brings earnings quality and margin resilience into focus for investors.
See our full analysis for Mechanics Bancorp.With the headline numbers on the table, the next step is to examine how this earnings profile compares with the prevailing narratives about Mechanics Bancorp and to consider where those narratives might need updating.
Curious how numbers become stories that shape markets? Explore Community Narratives
166.5% earnings growth backs 34.1% margin
- Over the last 12 months, Mechanics Bancorp reported earnings growth of 166.5% with a net profit margin of 34.1%, compared with 16.3% a year earlier, on trailing revenue of US$566.7 million and net income of US$193.1 million.
- What stands out for a bullish view is that this strong trailing profitability arrives alongside a more modest five year average earnings growth of 1.1% a year, which:
- Supports optimism around the recent 166.5% profit increase and 34.1% margin, because they sit well above that longer term average.
- Also reminds you that the longer history has been much steadier, so any bullish case has to rest mainly on the recent 12 month performance rather than a long multi year record.
P/E premium to banks at 17.2x
- The shares trade on a trailing P/E of 17.2x, compared with 11.8x for the US Banks industry and 15.3x for peers, while still below the broader US market P/E of 19.2x.
- Critics highlight that this valuation premium sits alongside an unstable dividend track record, which:
- Means investors are paying more than the sector average on a P/E basis even though income reliability from dividends is flagged as a risk.
- May lead some bearish voices to question how much of the 166.5% trailing earnings growth is already reflected in the 17.2x multiple compared with the 11.8x industry level.
DCF value slightly below US$14.99 share price
- The current share price of US$14.99 sits modestly above the DCF fair value of about US$14.47, indicating only a small gap between price and that cash flow estimate.
- Bears argue that paying above both the industry P/E and the DCF fair value leaves limited room for error, which:
- Lines up with the data that the stock trades at 17.2x earnings versus the 11.8x industry average while the DCF fair value is below the market price.
- Combines with the unstable dividend history to focus the bearish narrative on valuation sensitivity rather than on the recent 34.1% net margin alone.
Next Steps
Don't just look at this quarter; the real story is in the long-term trend. We've done an in-depth analysis on Mechanics Bancorp's growth and its valuation to see if today's price is a bargain. Add the company to your watchlist or portfolio now so you don't miss the next big move.
See What Else Is Out There
Mechanics Bancorp’s premium 17.2x P/E, modest gap to DCF value, and unstable dividend record leave little room for comfort if expectations change.
If you do not want to wrestle with payout uncertainty while paying a premium, use our these 1804 dividend stocks with yields > 3% to focus on income ideas with more consistent yields and policies.
This article by Simply Wall St is general in nature. We provide commentary based on historical data and analyst forecasts only using an unbiased methodology and our articles are not intended to be financial advice. It does not constitute a recommendation to buy or sell any stock, and does not take account of your objectives, or your financial situation. We aim to bring you long-term focused analysis driven by fundamental data. Note that our analysis may not factor in the latest price-sensitive company announcements or qualitative material. Simply Wall St has no position in any stocks mentioned.
Have feedback on this article? Concerned about the content? Get in touch with us directly. Alternatively, email editorial-team@simplywallst.com