
- LIVE QUOTES
- LEARN
- HELP
 Nasdaq
 Wall Street Journal
EN
Is It Too Late To Consider Sterling Infrastructure (STRL) After Its 151% One Year Rally?
- If you are looking at Sterling Infrastructure and wondering whether the current share price still offers value, you are not alone.
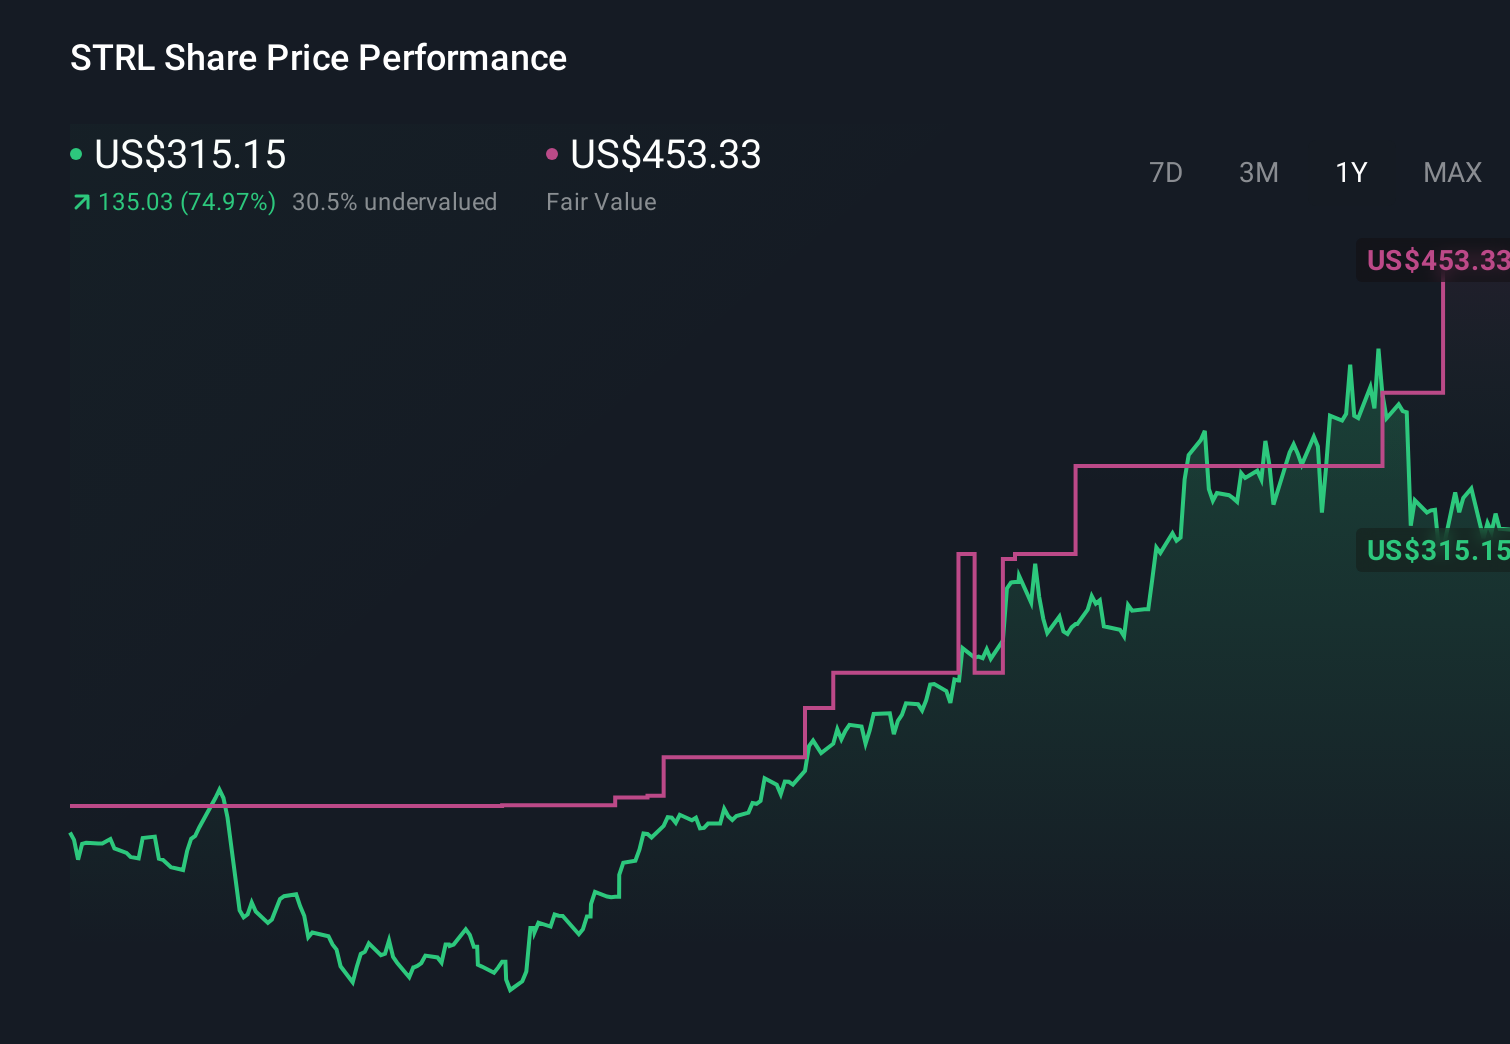
- The stock last closed at US$357.91, with returns of 1.9% over 7 days, 16.9% over 30 days, 12.1% year to date, 151.3% over 1 year and a very large gain over 5 years.
- Recent coverage has focused on the company as an infrastructure and construction player that is now firmly on many investors' radars. This helps explain why the share price has been so strong over different time frames. With more attention on the business model and project pipeline, questions about what counts as a fair price are becoming more common.
- Simply Wall St currently gives Sterling Infrastructure a valuation score of 2 out of 6. Next we will look at how different valuation approaches judge the stock, and then finish with a way to tie those methods together so you can see the bigger picture.
Sterling Infrastructure scores just 2/6 on our valuation checks. See what other red flags we found in the full valuation breakdown.
Approach 1: Sterling Infrastructure Discounted Cash Flow (DCF) Analysis
A Discounted Cash Flow, or DCF, model estimates what a company might be worth today by projecting its future cash flows and discounting them back to a present value using a required rate of return.
For Sterling Infrastructure, the model used here is a 2 Stage Free Cash Flow to Equity approach. The latest twelve month free cash flow is around US$353.7 million. Analysts provide explicit forecasts for the next few years, and beyond that Simply Wall St extrapolates the trend to build a ten year path of cash flows, reaching a projected free cash flow of about US$528.4 million in 2035.
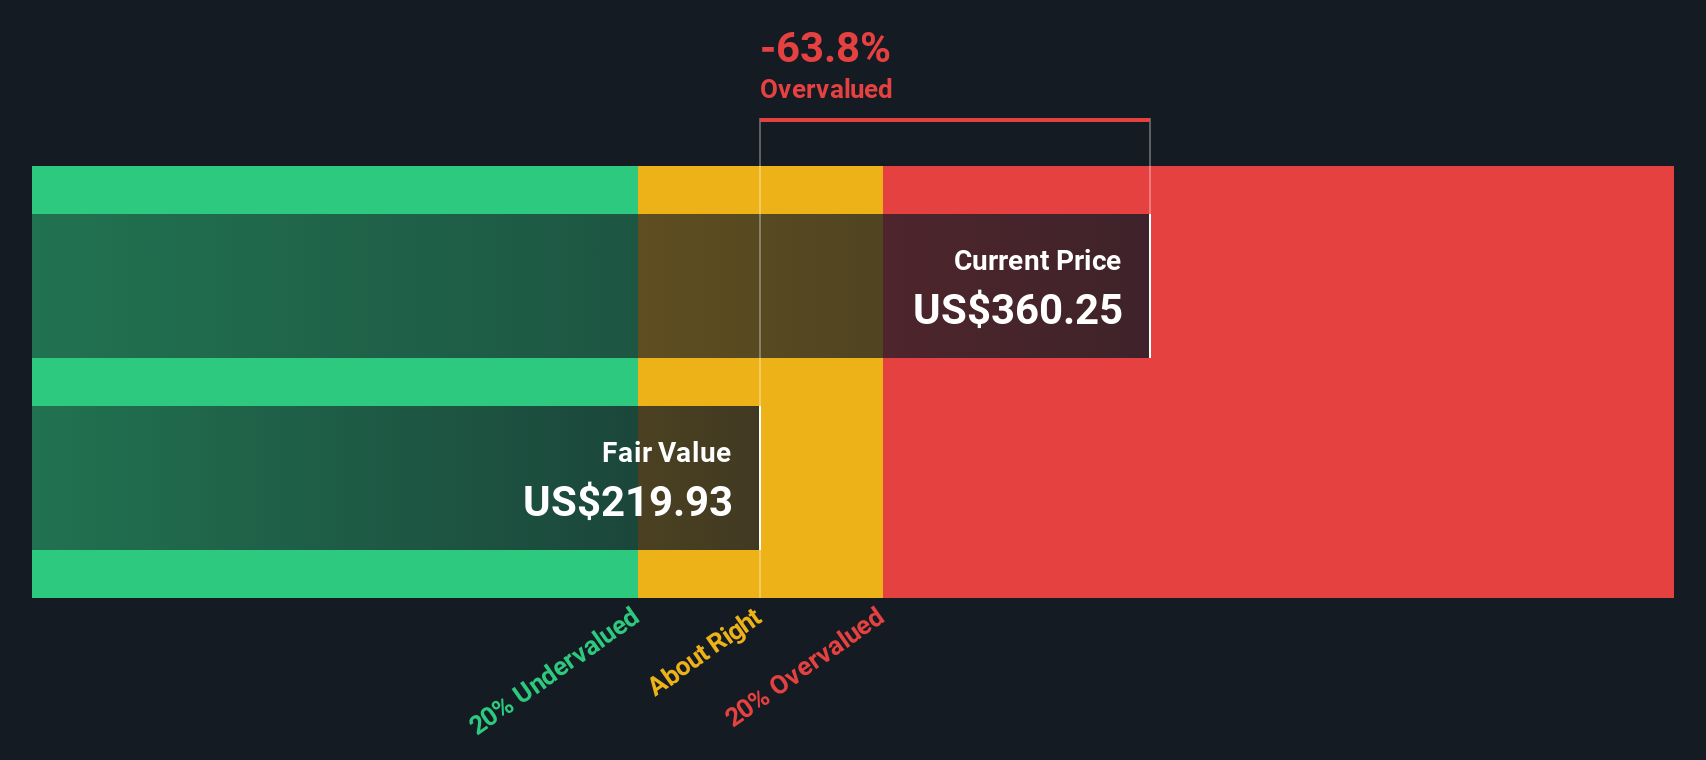
When all of those projected cash flows are discounted back and summed, the model arrives at an estimated intrinsic value of about US$250.26 per share. Compared with the recent share price of US$357.91, this DCF output suggests Sterling Infrastructure is around 43.0% overvalued on this measure.
Result: OVERVALUED
Our Discounted Cash Flow (DCF) analysis suggests Sterling Infrastructure may be overvalued by 43.0%. Discover 872 undervalued stocks or create your own screener to find better value opportunities.
Approach 2: Sterling Infrastructure Price vs Earnings
For a profitable company like Sterling Infrastructure, the P/E ratio is a useful shorthand for how much investors are paying for each dollar of earnings. Higher growth expectations or lower perceived risk usually justify a higher “normal” P/E, while slower growth or higher risk tend to point to a lower one.
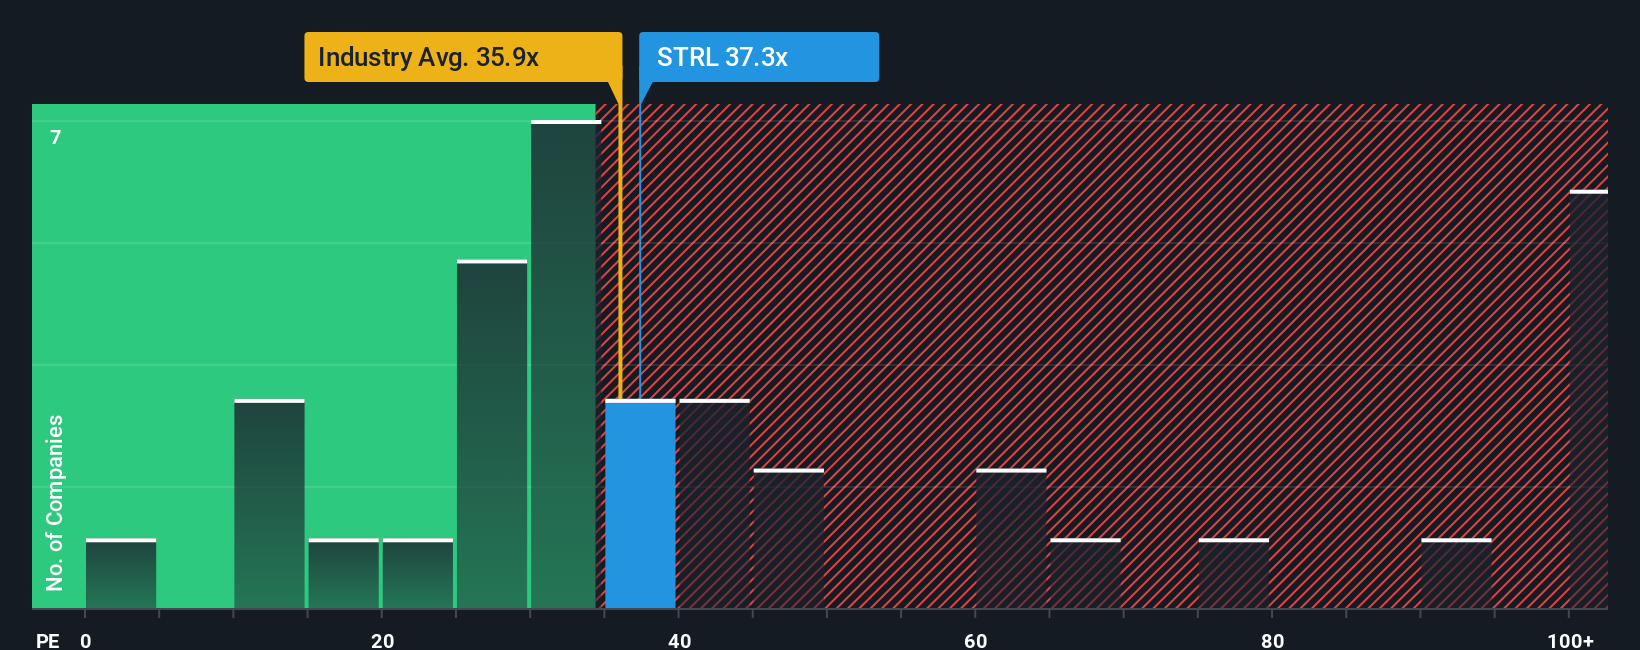
Sterling Infrastructure currently trades on a P/E of 34.82x. That sits below the Construction industry average of 36.81x, but above the peer group average of 29.08x, so a simple comparison sends a mixed signal about how demanding the current valuation is.
Simply Wall St tackles this by estimating a proprietary “Fair Ratio” for the stock. This is the P/E they would expect given the company’s earnings growth profile, margins, industry, market cap and risk characteristics. Because it brings all of those elements together, it can give you a more tailored view than looking only at broad industry or peer averages.
For Sterling Infrastructure, the Fair Ratio is 32.44x versus the current 34.82x. This points to the shares trading above that blended benchmark, so on this metric the stock screens as overvalued.
Result: OVERVALUED
P/E ratios tell one story, but what if the real opportunity lies elsewhere? Discover 1418 companies where insiders are betting big on explosive growth.
Upgrade Your Decision Making: Choose your Sterling Infrastructure Narrative
Earlier we mentioned that there is an even better way to understand valuation, so let us introduce you to Narratives, which are simply your own story about a company tied directly to numbers like fair value, future revenue, earnings and margins.
On Simply Wall St, Narratives are available on the Community page and let you link your view of Sterling Infrastructure’s business, projects and risks to a concrete financial forecast. This then feeds into an estimated fair value you can compare with the current share price when deciding whether it looks attractive or stretched.
Because Narratives on the platform are updated when new information appears, such as company news or earnings releases, your fair value view can adjust as the story evolves instead of staying fixed while the data moves on.
For example, one Sterling Infrastructure Narrative might assume a relatively conservative revenue path and margin profile that leads to a lower fair value. Another might build in stronger revenue and margin assumptions that support a higher fair value, showing how different investors can look at the same company and reach very different conclusions.
Do you think there's more to the story for Sterling Infrastructure? Head over to our Community to see what others are saying!
This article by Simply Wall St is general in nature. We provide commentary based on historical data and analyst forecasts only using an unbiased methodology and our articles are not intended to be financial advice. It does not constitute a recommendation to buy or sell any stock, and does not take account of your objectives, or your financial situation. We aim to bring you long-term focused analysis driven by fundamental data. Note that our analysis may not factor in the latest price-sensitive company announcements or qualitative material. Simply Wall St has no position in any stocks mentioned.
Have feedback on this article? Concerned about the content? Get in touch with us directly. Alternatively, email editorial-team@simplywallst.com