
- LIVE QUOTES
- LEARN
- HELP
 Nasdaq
 Wall Street Journal
EN
Has Scotts Miracle-Gro (SMG) Finally Found A Reasonable Entry Point After Recent Rebound?
- For investors wondering if Scotts Miracle-Gro at around US$65 a share still offers value, or if the easy money has already been made, this article is designed to address that question directly.
- The stock has recently posted returns of 5.0% over 7 days, 13.4% over 30 days and 10.1% year to date. However, the past 1 year, 3 year and 5 year returns of 4.8%, 11.5% and 67.1% declines present a different side of the story.
- These mixed returns reflect a period in which investors continue to reassess the outlook for Scotts Miracle-Gro and the wider materials and home gardening space. The stock's longer term pullback, combined with more recent gains, has kept attention on whether the current price reflects the company’s fundamentals or lingering caution.
- On our 6 point valuation checklist Scotts Miracle-Gro scores 2 out of 6, which suggests some potential value flags as well as areas where the stock does not appear undervalued. Next we will run through the usual valuation methods before finishing with a different way to think about what the market might be pricing in.
Scotts Miracle-Gro scores just 2/6 on our valuation checks. See what other red flags we found in the full valuation breakdown.
Approach 1: Scotts Miracle-Gro Discounted Cash Flow (DCF) Analysis
A Discounted Cash Flow, or DCF, model estimates what a company might be worth by projecting its future cash flows and then discounting those back to today’s value. It is essentially asking what those future dollars are worth in today’s terms.
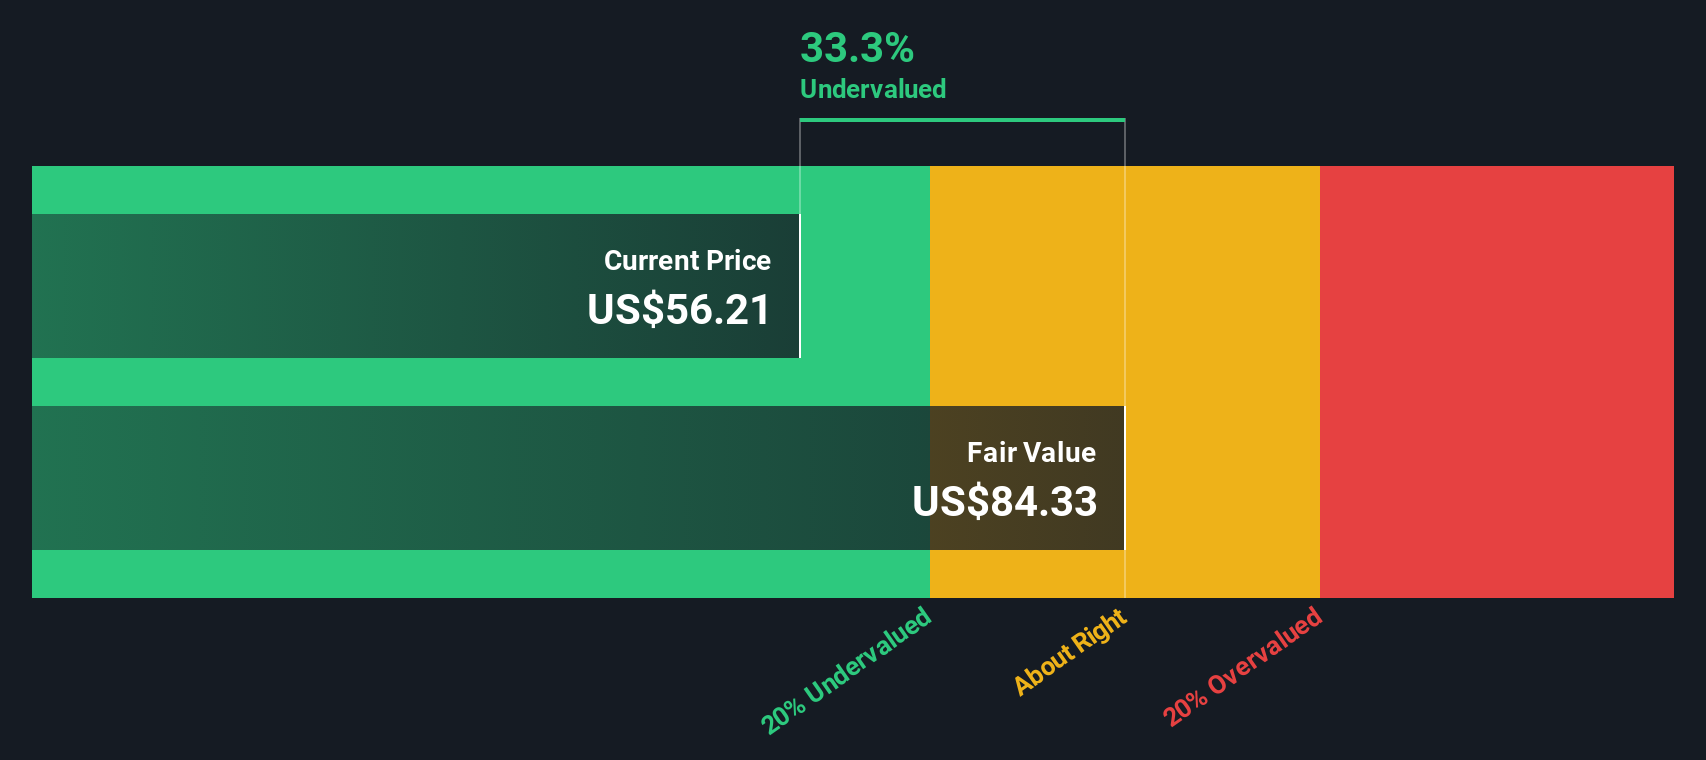
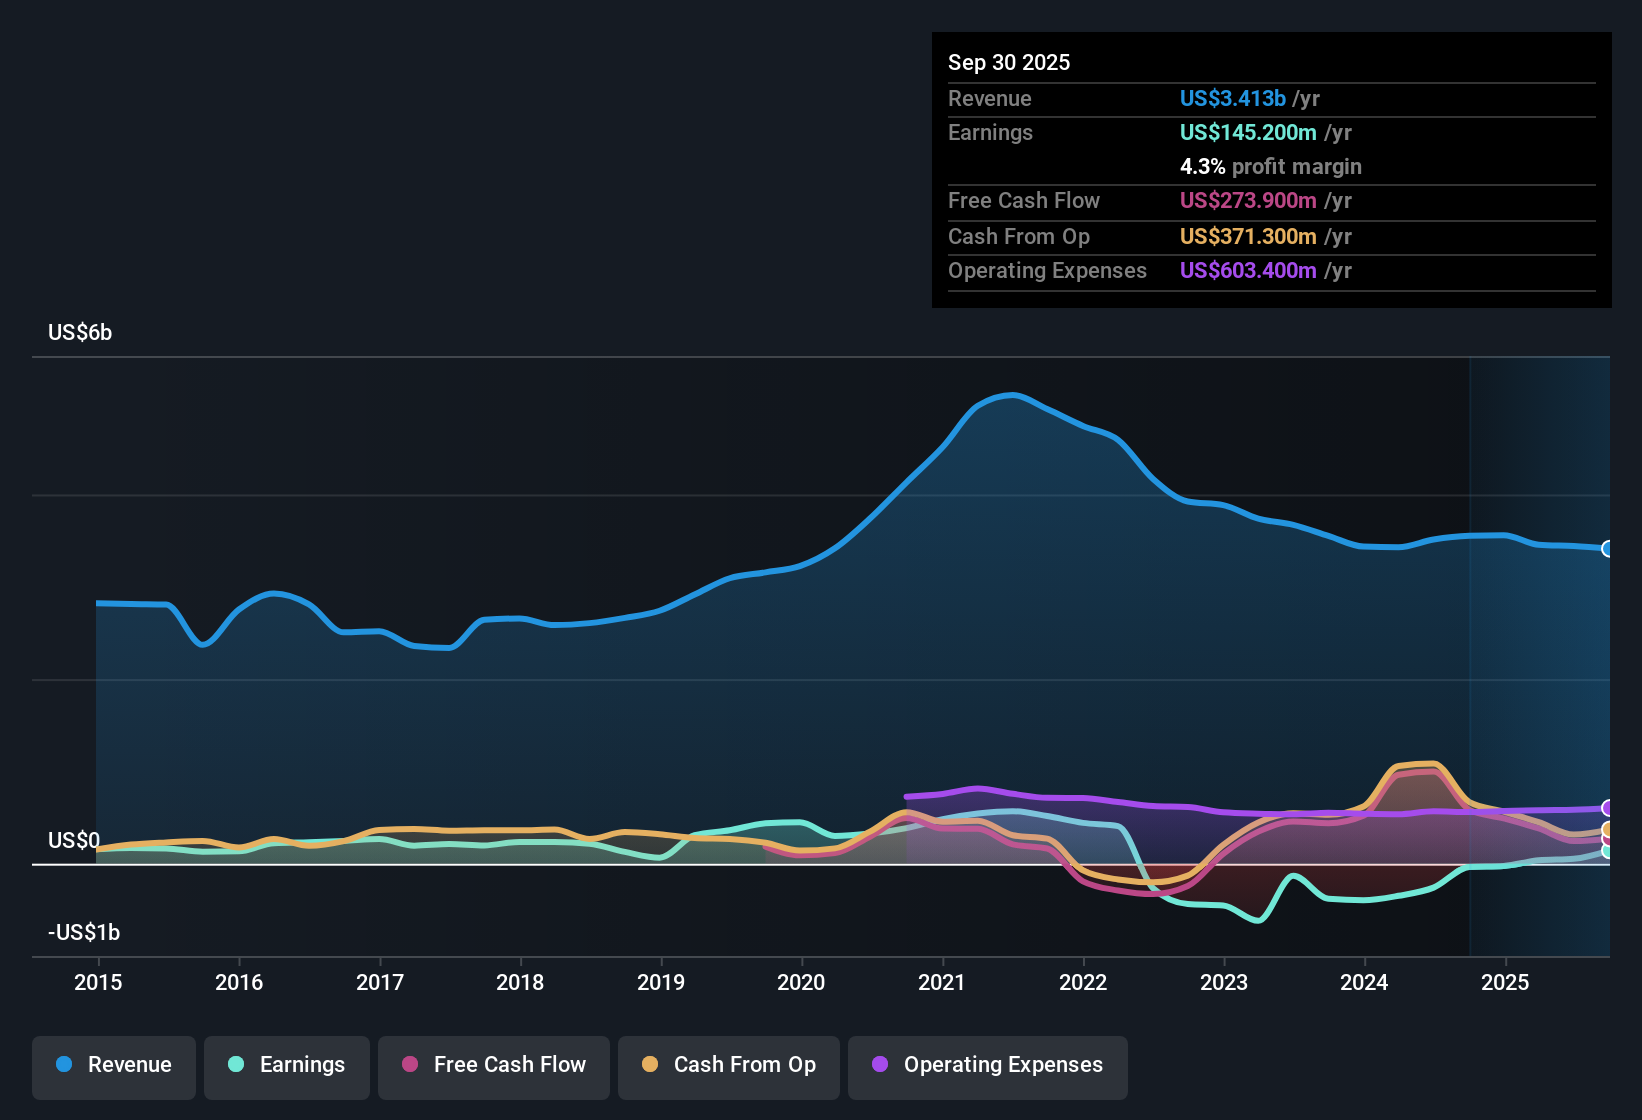
For Scotts Miracle-Gro, the model used is a 2 Stage Free Cash Flow to Equity approach. The latest twelve month Free Cash Flow is about $281.3 million, and analysts and internal estimates project annual Free Cash Flow between roughly $275 million and $312 million over the next decade. For example, Simply Wall St has $283 million projected for 2028, with later years extrapolated rather than based on formal analyst forecasts.
When all of those projected cash flows are discounted back, the DCF model arrives at an estimated intrinsic value of about $75.45 per share. Compared with a current share price around $65, this implies the stock is priced at roughly a 13.3% discount, which indicates Scotts Miracle-Gro is undervalued according to this model.
Result: UNDERVALUED
Our Discounted Cash Flow (DCF) analysis suggests Scotts Miracle-Gro is undervalued by 13.3%. Track this in your watchlist or portfolio, or discover 869 more undervalued stocks based on cash flows.
Approach 2: Scotts Miracle-Gro Price vs Earnings
For a company that is generating earnings, the P/E ratio is a straightforward way to see how much you are paying for each dollar of profit. A higher or lower P/E often reflects what the market thinks about a company’s growth prospects and risk profile, with stronger growth and lower perceived risk usually supporting a higher “normal” P/E level.
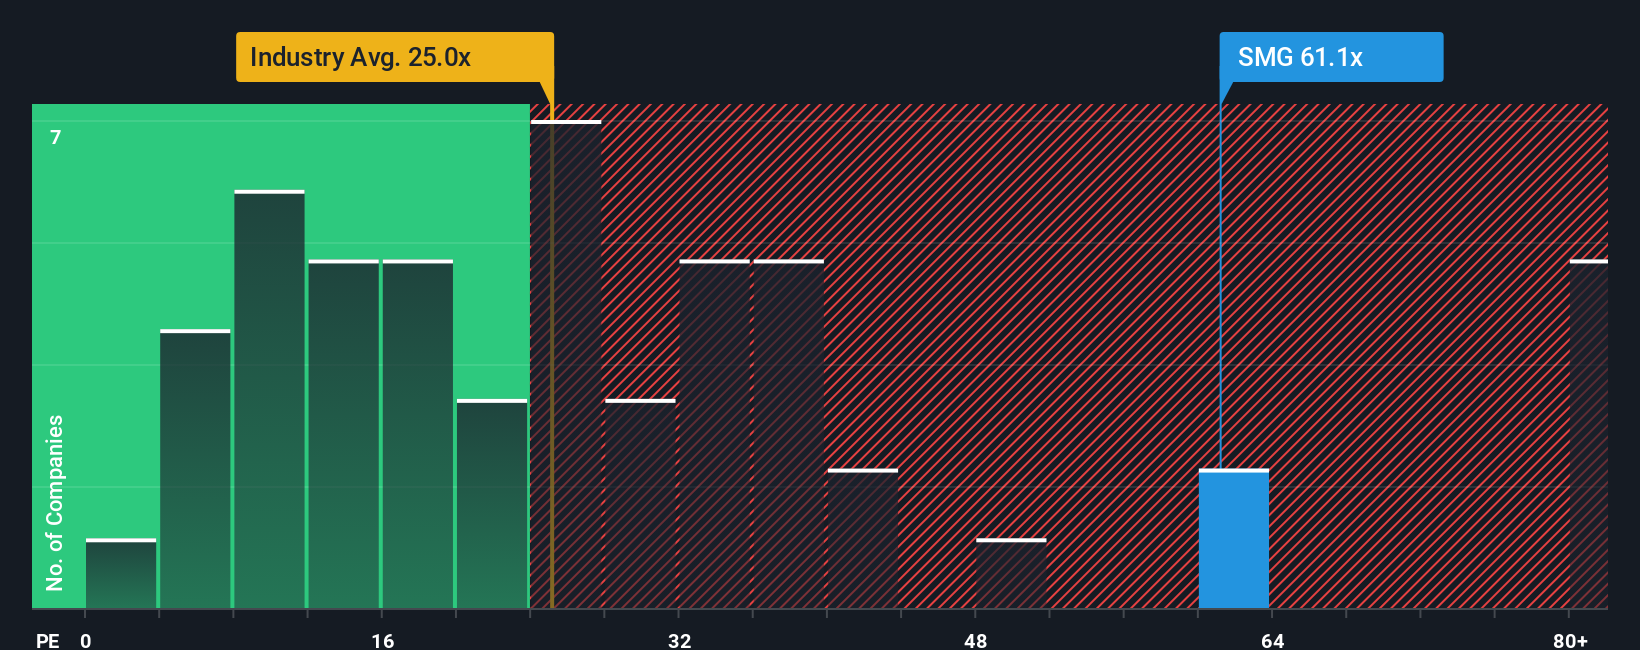
Scotts Miracle-Gro currently trades on a P/E of 23.21x. That sits below the Chemicals industry average of 25.74x, but above the peer group average of 11.44x. In other words, the stock is priced in the middle of those two reference points. Simply Wall St’s Fair Ratio for Scotts Miracle-Gro is 19.63x, which is its view of what a reasonable P/E might look like after considering factors such as earnings growth, profit margins, industry, market cap and specific risks.
This Fair Ratio is more tailored than a simple peer or industry comparison because it attempts to reflect the company’s own characteristics rather than averages that may not be a close match. With the current P/E of 23.21x sitting above the Fair Ratio of 19.63x, the multiple suggests the shares are trading at a richer level than that Fair Ratio implies.
Result: OVERVALUED
P/E ratios tell one story, but what if the real opportunity lies elsewhere? Discover 1418 companies where insiders are betting big on explosive growth.
Upgrade Your Decision Making: Choose your Scotts Miracle-Gro Narrative
Earlier we mentioned that there is an even better way to understand valuation, so let us introduce you to Narratives, a simple tool that lets you tell a clear story about Scotts Miracle-Gro, link that story to your assumptions for future revenue, earnings and margins, and then see how those assumptions translate into a Fair Value that you can compare with today’s share price.
On Simply Wall St’s Community page, used by millions of investors, a Narrative is your personal take on the company that feeds directly into a forecast and a fair value estimate. This allows you to quickly see whether your view suggests the stock looks cheap or expensive relative to the current price and decide if that lines up with your own buy or sell thresholds.
Narratives update automatically when new information such as earnings releases or news is added. This helps your story and fair value stay aligned with the latest numbers without you needing to rebuild a model each time.
For Scotts Miracle-Gro, one investor might build a Narrative that supports a higher fair value based on more optimistic assumptions, while another might set a lower fair value using more cautious expectations for future performance.
Do you think there's more to the story for Scotts Miracle-Gro? Head over to our Community to see what others are saying!
This article by Simply Wall St is general in nature. We provide commentary based on historical data and analyst forecasts only using an unbiased methodology and our articles are not intended to be financial advice. It does not constitute a recommendation to buy or sell any stock, and does not take account of your objectives, or your financial situation. We aim to bring you long-term focused analysis driven by fundamental data. Note that our analysis may not factor in the latest price-sensitive company announcements or qualitative material. Simply Wall St has no position in any stocks mentioned.
Have feedback on this article? Concerned about the content? Get in touch with us directly. Alternatively, email editorial-team@simplywallst.com