
- LIVE QUOTES
- LEARN
- HELP
 Nasdaq
 Wall Street Journal
EN
Is It Time To Reassess Nomad Foods (NOMD) After A Five Year Share Price Slump
- If you are wondering whether Nomad Foods is starting to look like a value opportunity or just a value trap, this article will walk through what the current share price might be telling you.
- The stock recently closed at US$12.55, with returns of 6.0% over the past week, 0.2% over the past month, 3.2% year to date, but a 26.1% decline over the last year and a 47.4% decline over five years.
- These mixed returns put extra focus on what is currently priced into Nomad Foods. Long term holders have seen weaker multi year performance, while short term moves have been more positive. That backdrop makes it especially important to test whether the current valuation is supported by the fundamentals rather than short term sentiment alone.
- On Simply Wall St's 6 point valuation checklist, Nomad Foods scores a full 6 out of 6. This suggests the shares screen as undervalued across all the checks we use, and we will break down what that looks like across different valuation methods before finishing with a framework that can help you assess value more effectively for yourself.
Find out why Nomad Foods's -26.1% return over the last year is lagging behind its peers.
Approach 1: Nomad Foods Discounted Cash Flow (DCF) Analysis
A Discounted Cash Flow model takes estimates of the cash a business could generate in the future, then discounts those amounts back to what they might be worth today. For Nomad Foods, this is done using a 2 Stage Free Cash Flow to Equity model.
The latest twelve month free cash flow is about €318.7m, with Simply Wall St using analyst inputs where available and then extrapolating further out. For example, one of the internal projections for 2035 is free cash flow of roughly €338.4m, with intermediate years generally staying in the €290m to €330m range based on the model assumptions.
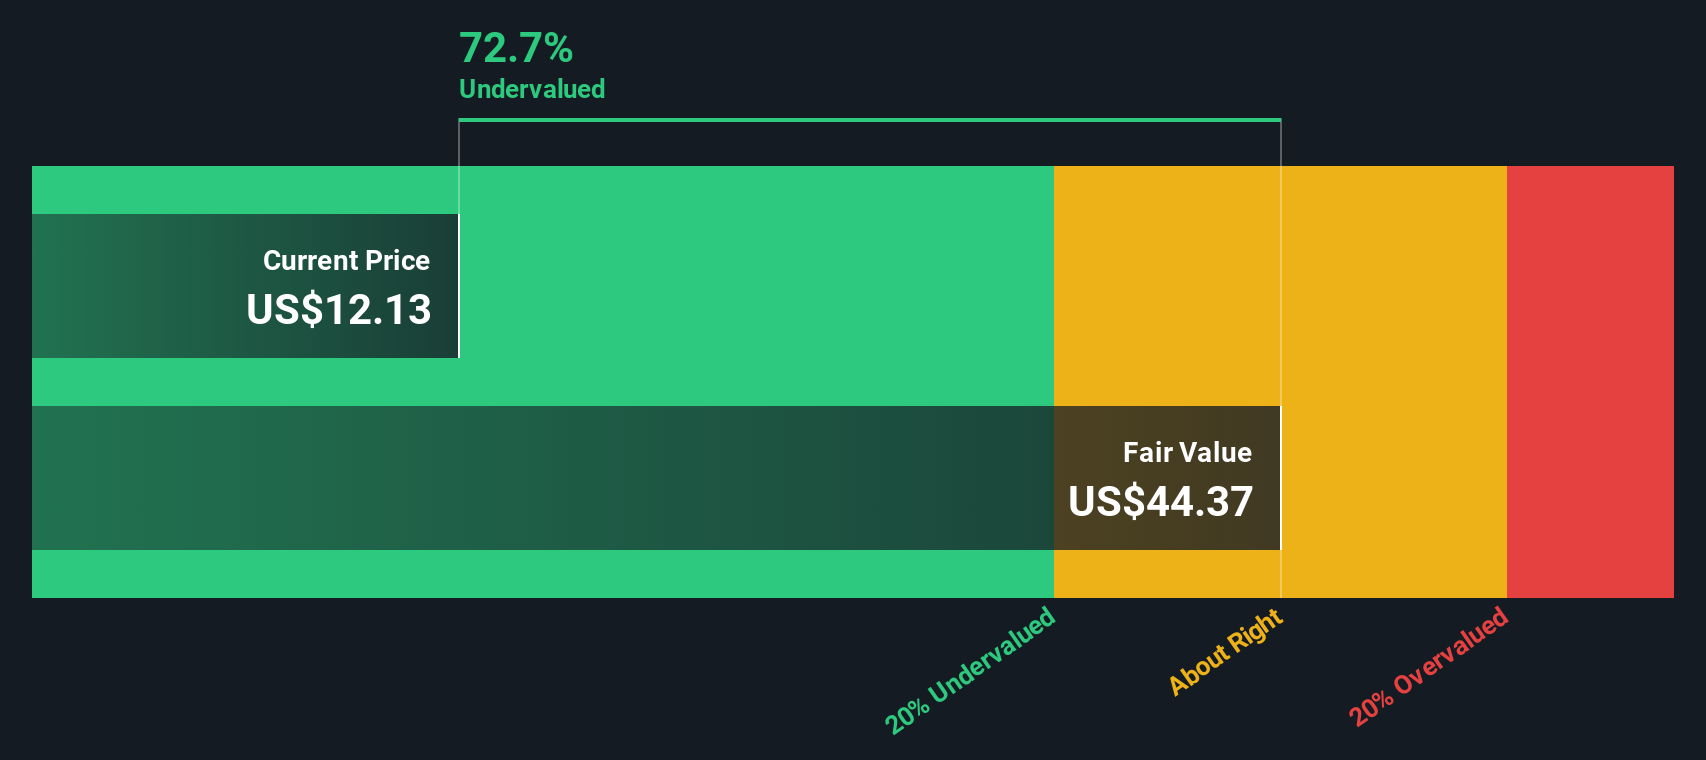
Discounting these projected cash flows back to today gives an estimated intrinsic value of €43.53 per share. Against the recent share price of US$12.55, the model indicates a 71.2% discount, which screens as a wide gap between price and modelled value.
Result: UNDERVALUED
Our Discounted Cash Flow (DCF) analysis suggests Nomad Foods is undervalued by 71.2%. Track this in your watchlist or portfolio, or discover 866 more undervalued stocks based on cash flows.
Approach 2: Nomad Foods Price vs Earnings
For a profitable company like Nomad Foods, the P/E ratio is a useful way to see what you are paying for each dollar of earnings. A higher or lower P/E often reflects what the market thinks about the company’s growth prospects and risk profile, so a business with stronger expected growth or lower perceived risk usually trades on a higher “normal” or “fair” P/E.
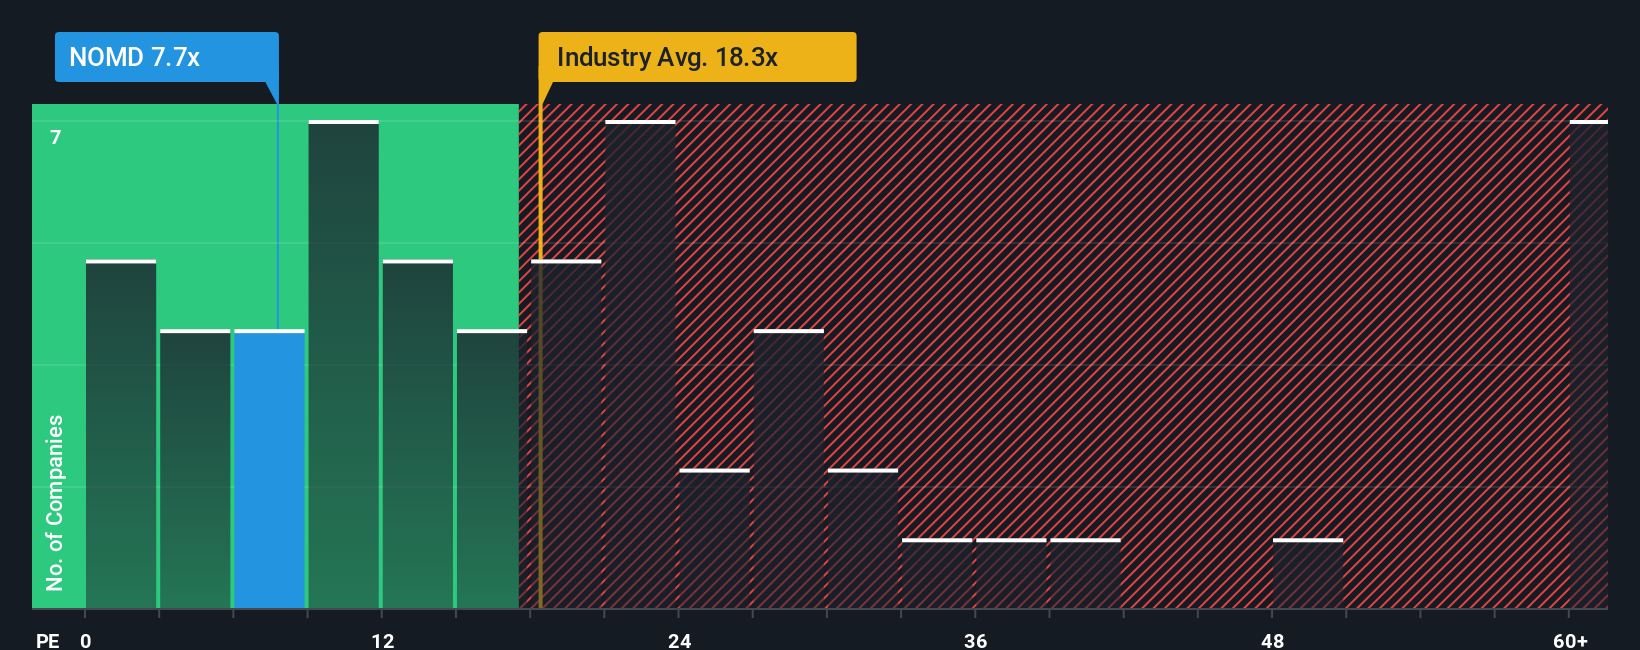
Nomad Foods currently trades on a P/E of 7.7x. That sits well below the Food industry average P/E of 20.9x and also below the peer group average of 75.6x. On the surface, that gap suggests the market is putting a much lower value on Nomad Foods’ earnings compared with many Food peers.
Simply Wall St’s Fair Ratio for Nomad Foods is 13.8x, which is an estimate of what the P/E might be given factors such as the company’s earnings growth profile, industry, profit margins, market cap and specific risks. Because it blends these company specific inputs, the Fair Ratio can be more informative than a simple comparison with broad industry or peer averages. With the shares at 7.7x compared with a Fair Ratio of 13.8x, the stock currently screens as undervalued on this earnings based view.
Result: UNDERVALUED
P/E ratios tell one story, but what if the real opportunity lies elsewhere? Discover 1414 companies where insiders are betting big on explosive growth.
Upgrade Your Decision Making: Choose your Nomad Foods Narrative
Earlier we mentioned that there is an even better way to understand valuation, so let us introduce you to Narratives, a simple way for you to tell the story behind your numbers by linking your view on Nomad Foods’ future revenue, earnings and margins to a forecast and then to your own fair value estimate.
On Simply Wall St, Narratives live in the Community page and let you set assumptions, see the fair value that falls out of those assumptions, then compare that fair value to the current share price. This can help you decide whether Nomad Foods looks attractive, fully valued, or expensive based on your own logic rather than someone else’s headline multiple.
Narratives update automatically when new information arrives, such as earnings releases or company news. This helps your fair value view stay aligned with the latest data without you having to rebuild a model each time.
For example, one Nomad Foods Narrative might assume relatively cautious revenue growth and modest margins that support a lower fair value, while another assumes stronger revenue growth and resilient margins that support a higher fair value. This gives you a clear sense of how different stories about the same company can lead to very different price signals.
Do you think there's more to the story for Nomad Foods? Head over to our Community to see what others are saying!

This article by Simply Wall St is general in nature. We provide commentary based on historical data and analyst forecasts only using an unbiased methodology and our articles are not intended to be financial advice. It does not constitute a recommendation to buy or sell any stock, and does not take account of your objectives, or your financial situation. We aim to bring you long-term focused analysis driven by fundamental data. Note that our analysis may not factor in the latest price-sensitive company announcements or qualitative material. Simply Wall St has no position in any stocks mentioned.
Have feedback on this article? Concerned about the content? Get in touch with us directly. Alternatively, email editorial-team@simplywallst.com