
- LIVE QUOTES
- LEARN
- HELP
 Nasdaq
 Wall Street Journal
EN
Is Allison Transmission (ALSN) Offering Attractive Value After Recent Share Price Stability?
- If you are wondering whether Allison Transmission Holdings is offering good value at around US$111.56 per share, this article walks through what the current price might mean for you.
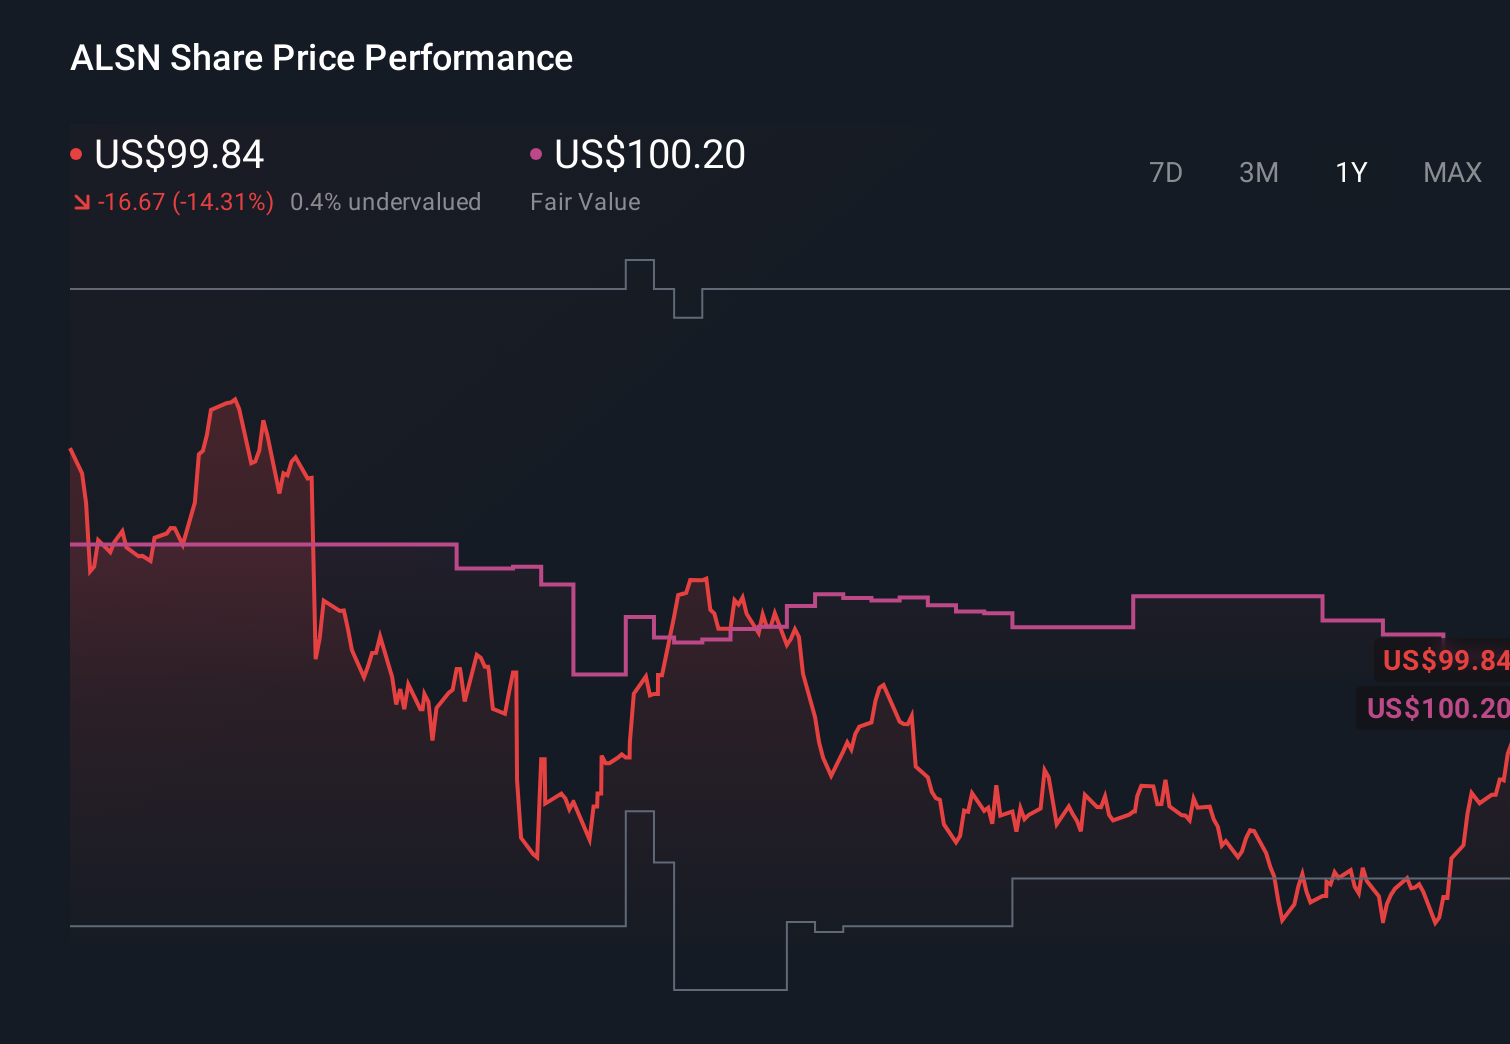
- The stock is roughly flat over the past week with a 0.5% gain, up 12.8% over the last month and year to date, while the 1 year return shows a 4.9% decline.
- Recent attention on Allison Transmission has centered on its position in the capital goods space and how investors are weighing its long term prospects against the current share price. This has kept valuation in focus as investors compare it with alternatives in the same industry.
- On Simply Wall St's valuation checks, Allison Transmission Holdings has a value score of 5 out of 6. Next we will look at how different valuation approaches arrive at that result, before finishing with an approach that can give an even richer picture of what the stock might be worth.
Approach 1: Allison Transmission Holdings Discounted Cash Flow (DCF) Analysis
A Discounted Cash Flow, or DCF, model estimates what a company could be worth today by projecting its future cash flows and then discounting those cash flows back to the present.
For Allison Transmission Holdings, Simply Wall St uses a 2 Stage Free Cash Flow to Equity model. The latest twelve month free cash flow is about $653.7 million. Analyst and extrapolated projections suggest free cash flow reaching $1,180 million by 2029, with intermediate estimates such as $728 million in 2026 and $926.3 million in 2027. Further projections beyond the analyst horizon are extrapolated by Simply Wall St to complete a ten year path.
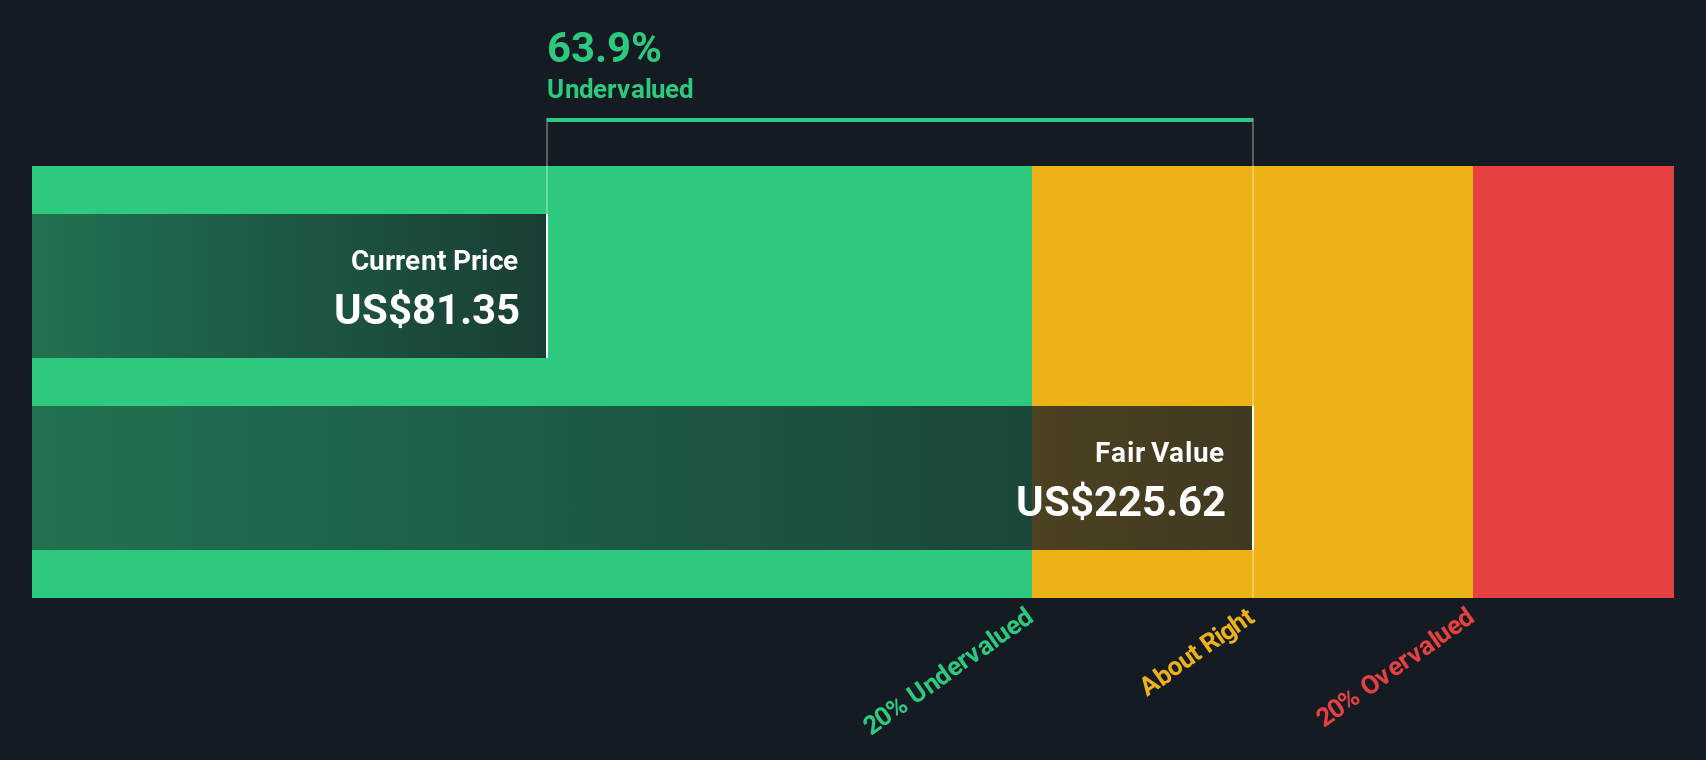
After discounting these projected cash flows, the model arrives at an estimated intrinsic value of $256.55 per share. Compared with the current share price of about $111.56, the DCF output implies the stock is 56.5% undervalued according to this methodology.
Result: UNDERVALUED
Our Discounted Cash Flow (DCF) analysis suggests Allison Transmission Holdings is undervalued by 56.5%. Track this in your watchlist or portfolio, or discover 866 more undervalued stocks based on cash flows.
Approach 2: Allison Transmission Holdings Price vs Earnings
For a profitable business like Allison Transmission Holdings, the P/E ratio is a useful way to see what you are paying for each dollar of current earnings. Investors typically accept a higher P/E when they expect stronger earnings growth or see lower risk, and a lower P/E when they are more cautious about growth or view the earnings stream as riskier.
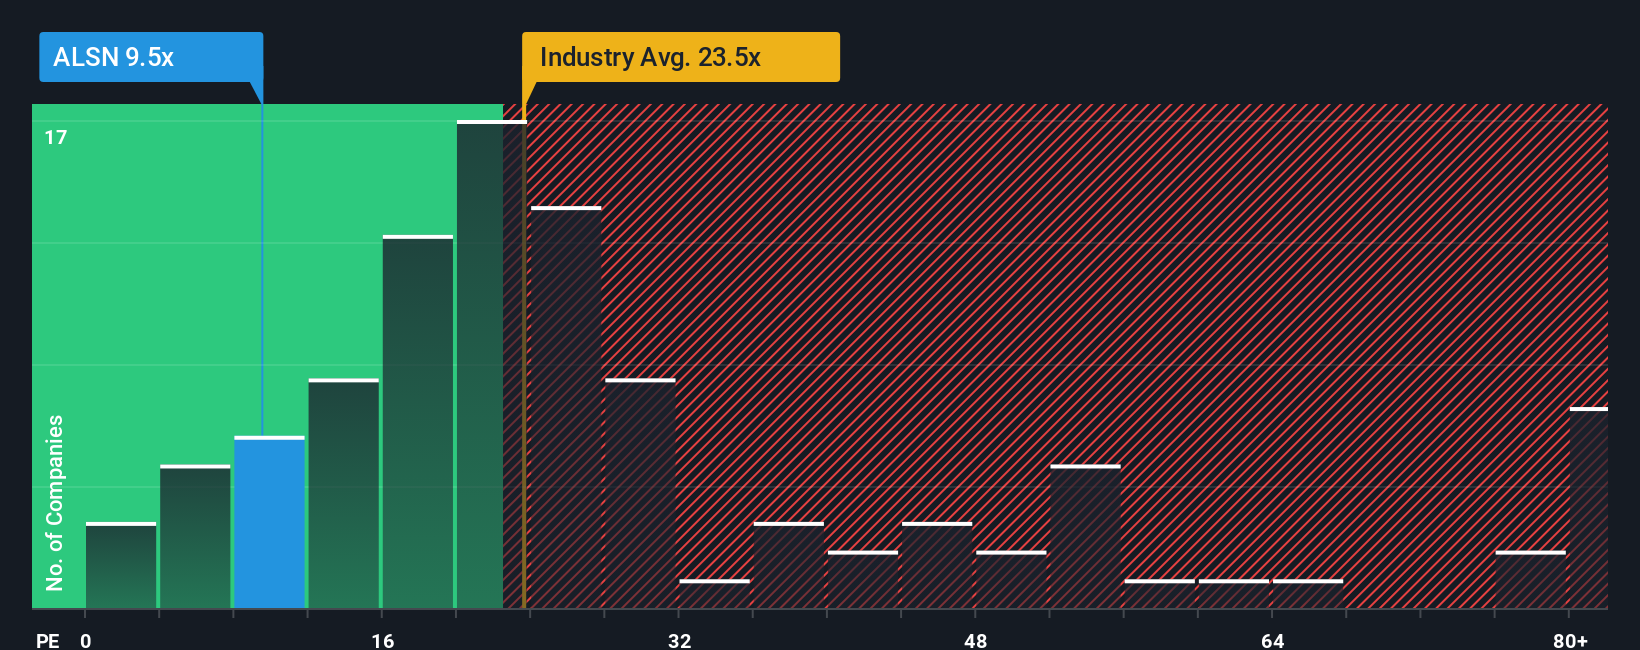
Allison Transmission’s current P/E is 13.28x. That sits below the Machinery industry average of 27.72x and below the peer average of 22.52x. On the surface, that gap suggests the market is putting a lower earnings multiple on Allison Transmission compared with many Machinery peers.
Simply Wall St also calculates a “Fair Ratio” for Allison Transmission of 23.92x. This is a proprietary estimate of what the P/E might be given factors such as the company’s earnings growth profile, profit margins, industry, market cap and its risks. Because it is tailored to the company rather than just copying what peers trade at, the Fair Ratio can be a more targeted benchmark than simple industry or peer comparisons. With the Fair Ratio above the current 13.28x P/E, this approach points to the shares trading below that modelled level.
Result: UNDERVALUED
P/E ratios tell one story, but what if the real opportunity lies elsewhere? Discover 1414 companies where insiders are betting big on explosive growth.
Upgrade Your Decision Making: Choose your Allison Transmission Holdings Narrative
Earlier we mentioned that there is an even better way to understand valuation, so let us introduce you to Narratives, which let you attach a clear story to your numbers by linking your view of Allison Transmission Holdings, your assumptions for future revenue, earnings and margins, and the fair value you arrive at.
A Narrative connects three things in one place: the business story you believe, the financial forecast that story implies, and the fair value that follows from those assumptions. On Simply Wall St you can build and compare these Narratives on the Community page that is already used by millions of investors.
Once you have a Narrative, you can compare its Fair Value to the current share price to help you decide how you view Allison Transmission. The platform will also update that Narrative automatically when new information such as earnings or news is added, so your view stays current without extra work.
For example, one investor might set a relatively conservative Narrative with a lower fair value and modest assumptions, while another might choose a higher fair value with stronger revenue and margin expectations for Allison Transmission Holdings.
Do you think there's more to the story for Allison Transmission Holdings? Head over to our Community to see what others are saying!
This article by Simply Wall St is general in nature. We provide commentary based on historical data and analyst forecasts only using an unbiased methodology and our articles are not intended to be financial advice. It does not constitute a recommendation to buy or sell any stock, and does not take account of your objectives, or your financial situation. We aim to bring you long-term focused analysis driven by fundamental data. Note that our analysis may not factor in the latest price-sensitive company announcements or qualitative material. Simply Wall St has no position in any stocks mentioned.
Have feedback on this article? Concerned about the content? Get in touch with us directly. Alternatively, email editorial-team@simplywallst.com