
- LIVE QUOTES
- LEARN
- HELP
 Nasdaq
 Wall Street Journal
EN
M/I Homes (MHO) Net Margin Compression Challenges Bullish Earnings Narratives
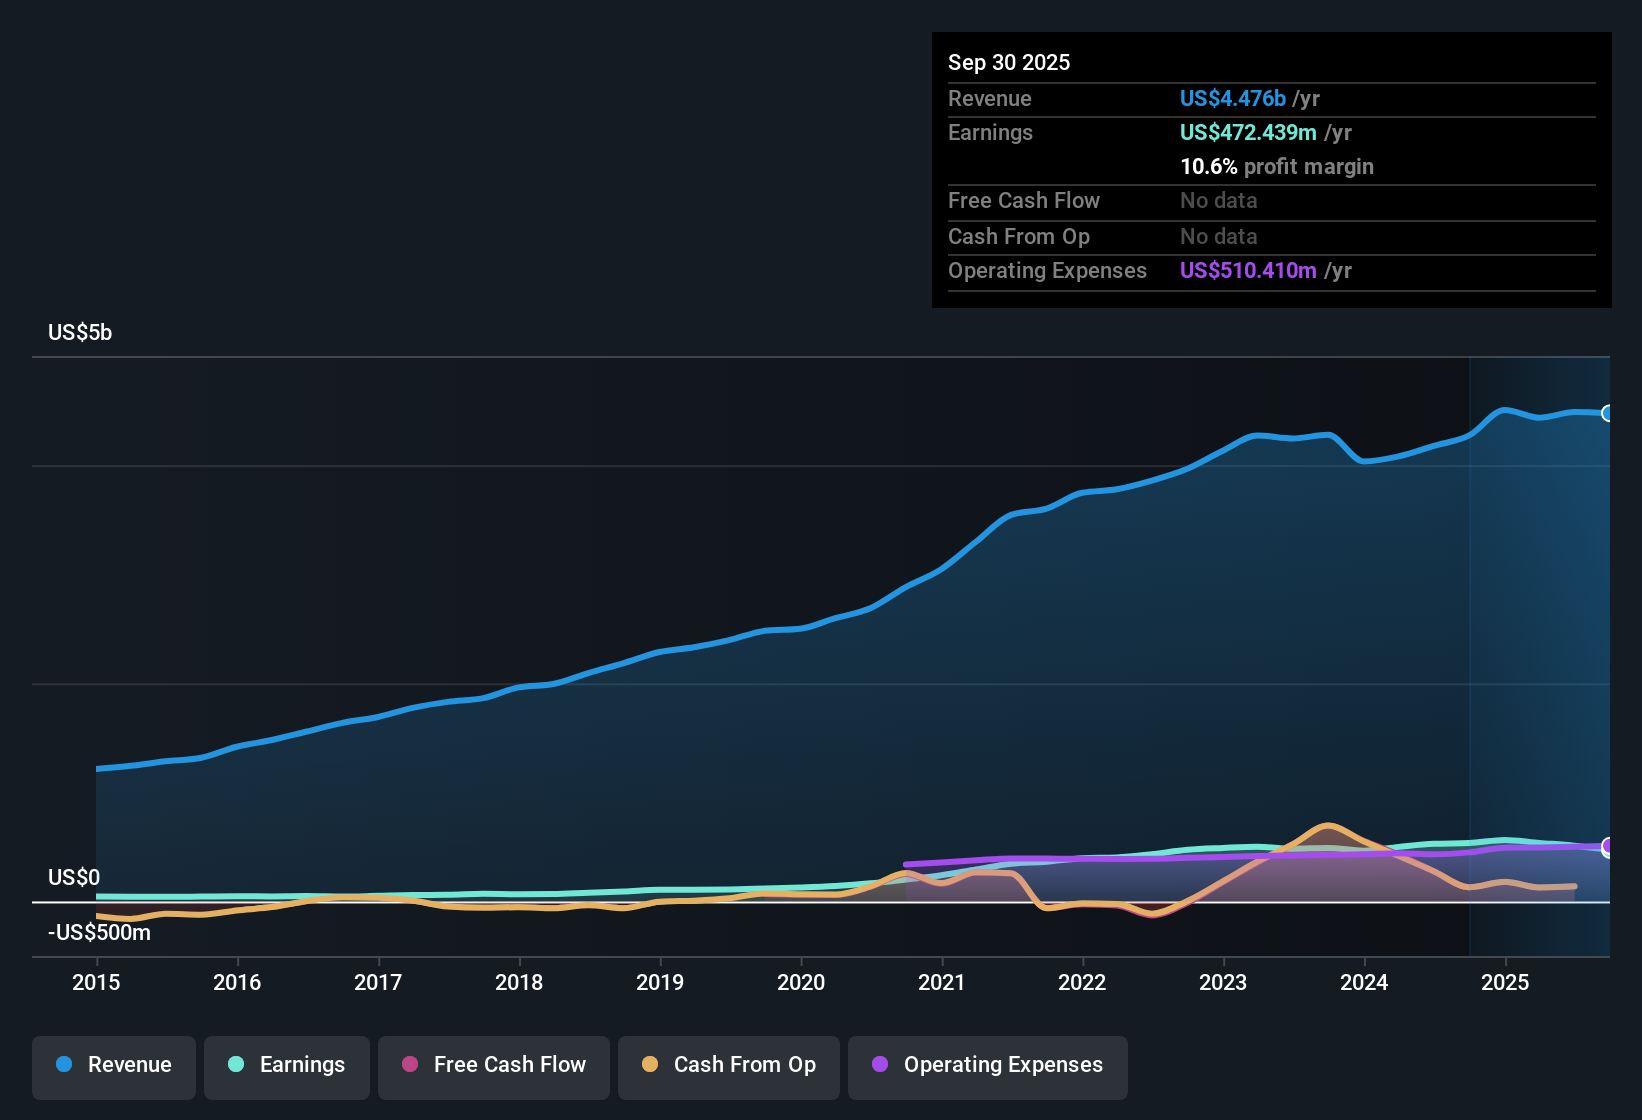
M/I Homes (MHO) has just posted its FY 2025 numbers, with Q4 revenue of US$1.1b and basic EPS of US$2.44, alongside trailing twelve month revenue of US$4.4b and EPS of US$15.07. Over recent quarters, revenue has moved between US$976.1m and US$1.2b while quarterly basic EPS has ranged from US$2.44 to US$4.85, giving investors a clear read on how earnings are tracking through the cycle. With net margins now at 9.1% versus 12.5% last year, the latest release puts profitability trends, rather than growth alone, at the center of the story.
See our full analysis for M/I Homes.With the headline numbers on the table, the next step is to see how they line up against the key narratives around M/I Homes, highlighting where the recent results support the consensus view and where they start to push back against it.
Curious how numbers become stories that shape markets? Explore Community Narratives
Net Margin Slips To 9.1% On Lower TTM Profit
- On a trailing twelve month basis, net income is US$402.9 million on US$4.4b of revenue, giving a 9.1% net margin compared with 12.5% a year earlier when net income was US$563.7 million on US$4.5b of revenue.
- What stands out against a more bullish take is that, even though five year earnings growth averaged 9.1% per year and earnings quality is described as high, the latest year shows lower profit and margin pressure, with TTM net income moving from US$563.7 million to US$402.9 million while revenue stayed in a similar US$4.3b to US$4.5b range.
- This combination of lower profit on broadly comparable revenue challenges a bullish view that past earnings growth alone can carry the story, because it shows margins are not holding at prior levels.
- At the same time, the high earnings quality assessment gives bulls a counterpoint, suggesting the lower margin is coming through cleanly in the accounts rather than being masked by one off items.
Analysts See Earnings Drifting 0.4% Lower Each Year
- Analysts are forecasting average earnings declines of about 0.4% per year over the next three years, alongside a modest 0.04% expected revenue decline per year, compared with the past five year earnings growth rate of 9.1% per year.
- Critics highlight this forecast as a bearish signal because it contrasts sharply with the five year growth record, with the latest TTM earnings also down from US$536.9 million at the start of FY 2025 to US$402.9 million by Q4.
- This shift from 9.1% annual earnings growth over five years to projected declines supports a bearish worry that the stronger phase of the cycle may already be behind the company.
- However, the fact that TTM revenue has stayed in a fairly tight band around US$4.4b while forecasts only call for a small 0.04% annual revenue decline suggests bears are focusing more on profitability compression than on a collapse in the top line.
P/E Of 8.8x And DCF Fair Value Of US$169.36
- The shares trade on a P/E of 8.8x, which sits below both the peer average of 9.5x and the US Consumer Durables industry average of 11.2x, while a DCF fair value estimate of US$169.36 is about 19.5% above the current share price of US$136.37.
- Supporters of a more bullish angle point to this valuation gap because it sits alongside high quality trailing earnings, with TTM EPS of US$15.07 and profit of US$402.9 million, arguing that current pricing may be reflecting the softer near term forecasts more heavily than the longer term record.
- The discount to both peer and industry P/E levels, together with the DCF fair value sitting roughly US$33 above the market price, supports the bullish case that the share price is not giving full credit to recent profitability.
- At the same time, the weaker net margin of 9.1% and the projected 0.4% annual earnings decline are figures skeptics can use to argue that the lower P/E is a response to earnings moving off their earlier highs.
Next Steps
Don't just look at this quarter; the real story is in the long-term trend. We've done an in-depth analysis on M/I Homes's growth and its valuation to see if today's price is a bargain. Add the company to your watchlist or portfolio now so you don't miss the next big move.
See What Else Is Out There
M/I Homes now faces thinner net margins and analyst expectations for slight earnings declines, even with revenue and reported earnings quality holding in a relatively tight range.
If you want companies where earnings and revenue trends lean more consistently in your favor, check out CTA_SCREENER_STABLE_GROWTH for ideas built around steadier performance.
This article by Simply Wall St is general in nature. We provide commentary based on historical data and analyst forecasts only using an unbiased methodology and our articles are not intended to be financial advice. It does not constitute a recommendation to buy or sell any stock, and does not take account of your objectives, or your financial situation. We aim to bring you long-term focused analysis driven by fundamental data. Note that our analysis may not factor in the latest price-sensitive company announcements or qualitative material. Simply Wall St has no position in any stocks mentioned.
Have feedback on this article? Concerned about the content? Get in touch with us directly. Alternatively, email editorial-team@simplywallst.com