
- LIVE QUOTES
- LEARN
- HELP
 Nasdaq
 Wall Street Journal
EN
Is Federal Realty (FRT) Pricing Reflect Its DCF Value Gap After Recent Share Weakness
- If you are wondering whether Federal Realty Investment Trust is attractively priced today, you are not alone. This article walks through what the current share price might be telling you about its value.
- The stock closed at US$100.59 recently, with a 1.1% decline over the past week and a 1.2% decline over the past month, while the 1 year return sits at a 2.8% decline and the 5 year return is 37.1%.
- Recent attention around Federal Realty Investment Trust has focused on its role as a retail focused real estate investment trust and how investors are weighing its track record against current market sentiment. This backdrop helps frame the modest short term share price declines and the relatively flat 3 year return of 0.4%.
- On our valuation framework, Federal Realty Investment Trust scores a 5 out of 6 for being undervalued across key checks. Next, we will walk through the main valuation methods behind that score and then finish with a more complete way to think about value beyond just the headline numbers.
Approach 1: Federal Realty Investment Trust Discounted Cash Flow (DCF) Analysis
A Discounted Cash Flow, or DCF, model looks at the cash the business is expected to generate in the future, then discounts those cash flows back to today to estimate what the whole company might be worth. Here it is based on adjusted funds from operations, which is a common cash flow metric for REITs.
For Federal Realty Investment Trust, the latest twelve month free cash flow input is about $570.2 million. Analysts provide explicit projections for the next few years, and beyond that, Simply Wall St extrapolates the cash flows. By 2030, the model uses a projected free cash flow of about $655.0 million, with intermediate years stepping up from an estimated $500.0 million in 2026. Each of these future cash flows is discounted back to today using the 2 Stage Free Cash Flow to Equity model.
Putting all of this together, the DCF model arrives at an estimated intrinsic value of about $143.59 per share, compared with the recent share price of $100.59. That gap implies the shares screen as around 29.9% undervalued on this framework.
Result: UNDERVALUED
Our Discounted Cash Flow (DCF) analysis suggests Federal Realty Investment Trust is undervalued by 29.9%. Track this in your watchlist or portfolio, or discover 865 more undervalued stocks based on cash flows.

Approach 2: Federal Realty Investment Trust Price vs Earnings
For a profitable business, the P/E ratio is a useful shorthand for how much you are paying for each dollar of earnings. It lets you quickly compare what the market is willing to pay for one company versus others earning similar profits.
What counts as a "fair" P/E usually reflects the balance between growth expectations and risk. Higher expected earnings growth or lower perceived risk can justify a higher multiple, while slower growth or higher risk tends to line up with a lower one.
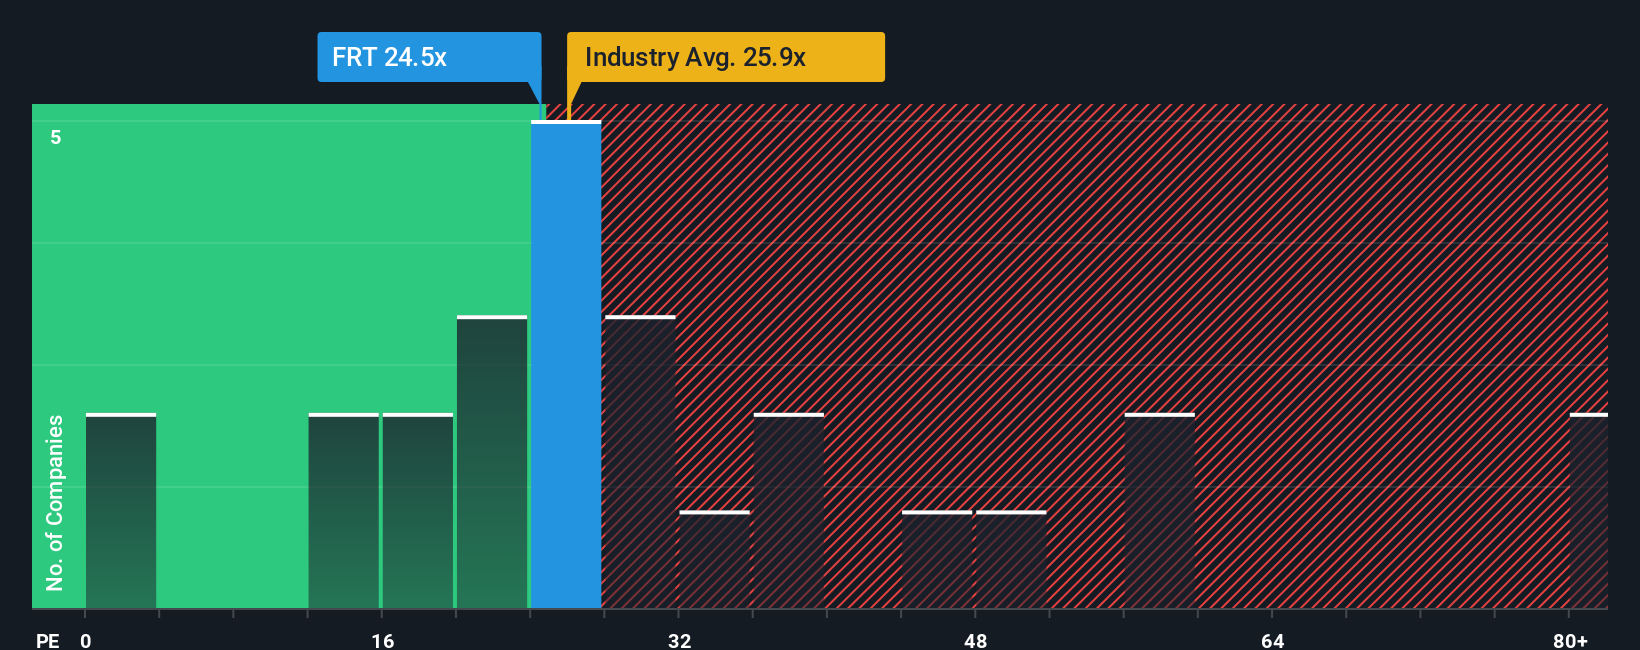
Federal Realty Investment Trust currently trades on a P/E of 25.71x. That sits below the Retail REITs industry average of 27.59x and the peer group average of 30.53x. Simply Wall St also calculates a proprietary Fair Ratio of 29.98x for Federal Realty Investment Trust. This Fair Ratio is designed to reflect the P/E you might expect given factors such as the company’s earnings profile, industry, profit margins, market cap and identified risks.
Because the Fair Ratio directly incorporates those company specific drivers, it can be more tailored than a simple comparison with industry or peer averages. With the current P/E of 25.71x sitting below the Fair Ratio of 29.98x, this framework points to the shares screening as undervalued on an earnings multiple basis.
Result: UNDERVALUED
P/E ratios tell one story, but what if the real opportunity lies elsewhere? Discover 1412 companies where insiders are betting big on explosive growth.
Upgrade Your Decision Making: Choose your Federal Realty Investment Trust Narrative
Earlier we mentioned that there is an even better way to understand valuation, so let us introduce you to Narratives. These let you attach a clear story to your numbers, including your own view of fair value and expectations for future revenue, earnings and margins.
A Narrative connects three parts in a straight line: the company story you believe, the financial forecast that follows from that story, and the fair value that drops out of those assumptions. On Simply Wall St, Narratives sit in the Community page and are designed to be easy to use, so you can quickly see how your view compares with what other investors are thinking.
Once you have a Narrative, you can compare its Fair Value with the current price to decide how you view Federal Realty Investment Trust, whether as a potential opportunity or as one to be cautious on, and the platform keeps that view updated when fresh news, earnings or other data arrive.
For example, one investor might see Federal Realty Investment Trust as worth well above today’s price, while another assigns a fair value well below it, showing how different stories can coexist around the same stock.
Do you think there's more to the story for Federal Realty Investment Trust? Head over to our Community to see what others are saying!

This article by Simply Wall St is general in nature. We provide commentary based on historical data and analyst forecasts only using an unbiased methodology and our articles are not intended to be financial advice. It does not constitute a recommendation to buy or sell any stock, and does not take account of your objectives, or your financial situation. We aim to bring you long-term focused analysis driven by fundamental data. Note that our analysis may not factor in the latest price-sensitive company announcements or qualitative material. Simply Wall St has no position in any stocks mentioned.
Have feedback on this article? Concerned about the content? Get in touch with us directly. Alternatively, email editorial-team@simplywallst.com