
- LIVE QUOTES
- LEARN
- HELP
 Nasdaq
 Wall Street Journal
EN
Chain Bridge Bancorp (CBNA) Margin Compression Reinforces Cautious Narratives Despite Solid FY 2025 Earnings
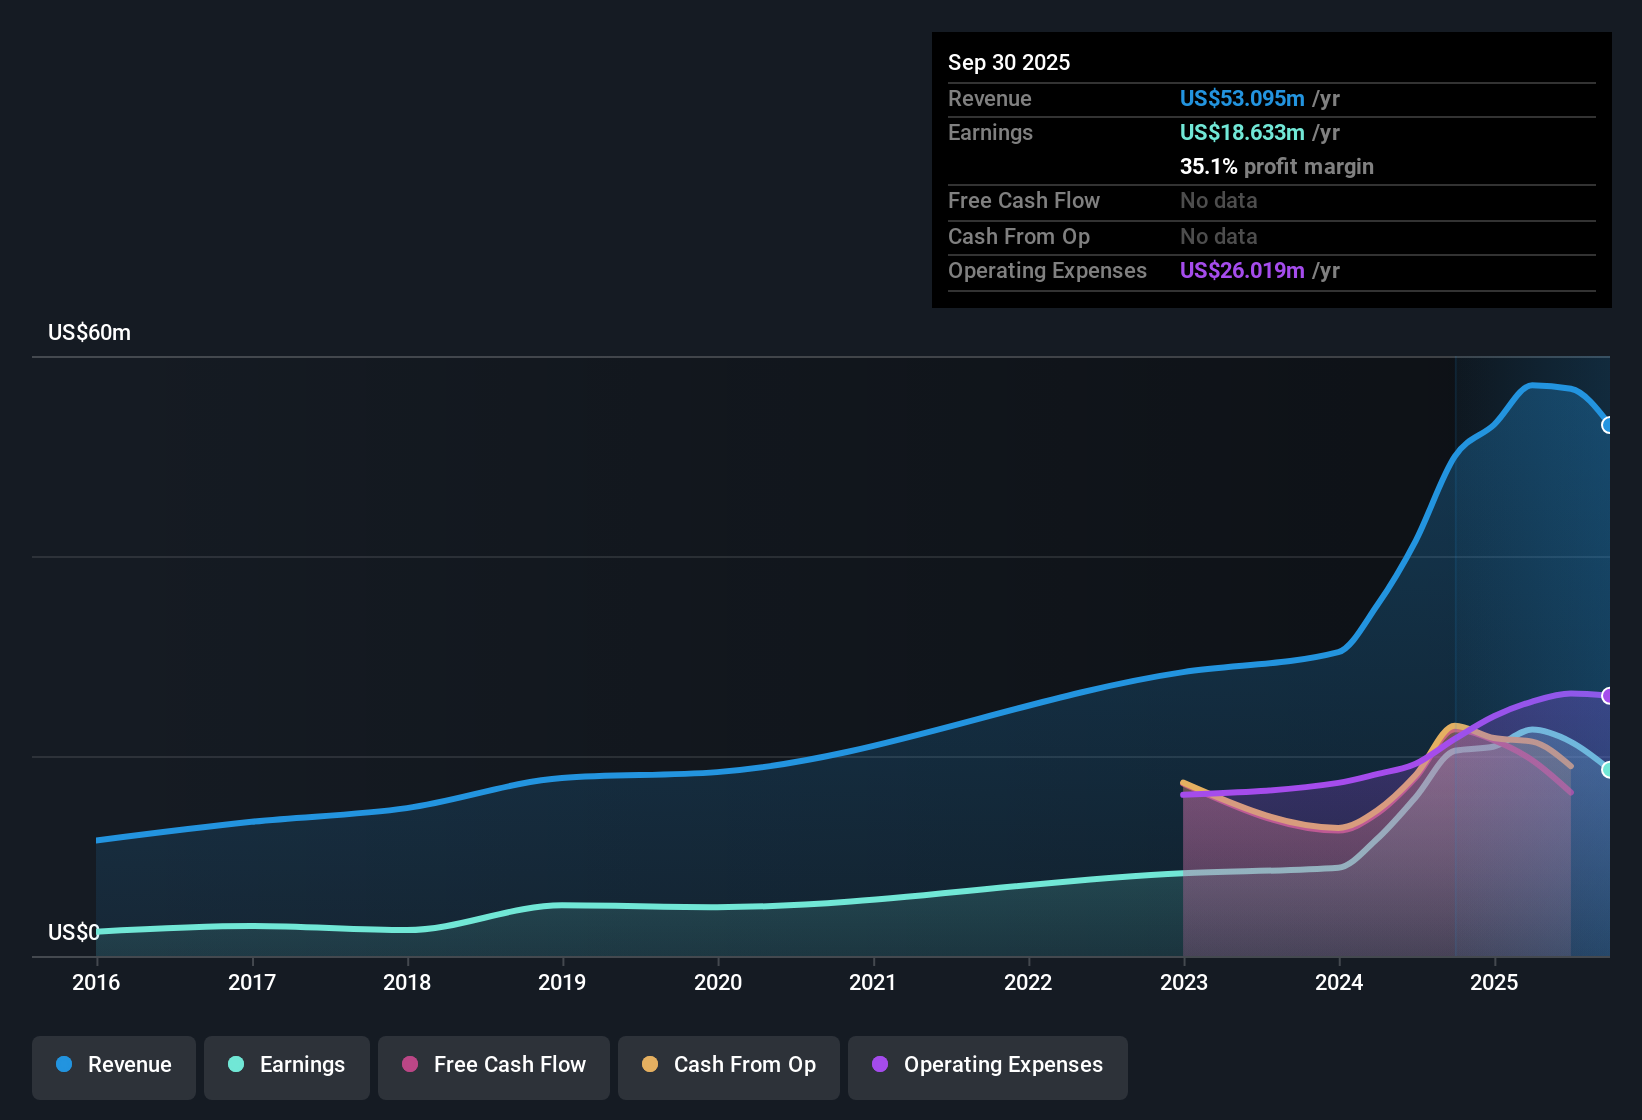
Chain Bridge Bancorp (CBNA) has wrapped up FY 2025 with fourth quarter revenue of US$14.7 million and basic EPS of US$0.81, backed by trailing twelve month revenue of US$55.5 million and EPS of US$3.08. Over the last twelve months, the company has seen revenue move from US$53.1 million to US$55.5 million and net income of US$20.9 million to US$20.2 million, while quarterly EPS ranged between US$0.70 and US$0.85 across 2025. With a trailing net profit margin of 36.5% and a Q4 net interest margin of 3.26%, the latest results put the focus firmly on how sustainably the bank is converting revenue into earnings.
See our full analysis for Chain Bridge Bancorp.With the headline numbers on the table, the next step is to set these results against the most widely held narratives about Chain Bridge Bancorp to see which stories the data supports and which ones start to look less convincing.
Curious how numbers become stories that shape markets? Explore Community Narratives
Margins Tighten From 39.4% To 36.5%
- Trailing net profit margin is 36.5% for the last 12 months, down from 39.4% a year earlier, while trailing net interest margin for FY 2025 is 3.39% and Q4 2025 net interest margin sits at 3.26%.
- Bears often focus on pressure on profitability, and this margin move gives them data to point to. At the same time, the numbers also show resilience, with:
- Net income over the last 12 months at US$20.2 million alongside revenue of US$55.5 million, which still converts a sizeable share of revenue into profit.
- The Q4 2025 cost to income ratio of 54.49% and the trailing 12 month ratio of 54.67%, indicating costs are being held in a reasonably tight band despite the margin compression.
Revenue Growth Of 4.4% Slower Than Market
- Revenue grew by 4.4% over the past year to US$55.5 million, and trailing revenue growth is 5.5% per year compared with a 10.6% per year benchmark for the broader US market.
- Critics highlight that the growth profile looks modest, and the data lines up with that view in several ways, with:
- Earnings per share forecast in the dataset at about 2.1% growth per year, which is well below the 16.1% per year forecast for US market earnings.
- Latest trailing EPS of US$3.08 compared with a description of negative earnings growth versus the 5 year average, reinforcing the idea that growth momentum has cooled relative to broader benchmarks.
P/E Of 11.1x And DCF Fair Value Gap
- CBNA trades on a trailing P/E of 11.1x at a share price of US$34.21, a touch below the US Banks industry average of 11.7x and slightly above the peer average of 10.8x, while a DCF fair value of US$106.09 in the dataset sits well above that share price.
- Supporters argue that mixed valuation multiples plus a large DCF fair value gap hint at potential value, and the numbers behind that argument are clear, with:
- The company valued in the dataset at around 3x the current share price using the DCF fair value, even though earnings growth is only described as modest at 2.1% per year.
- A P/E that is not stretched versus the wider US Banks industry at 11.7x, which may appeal to investors who want to balance that DCF upside against the slower growth and margin compression flagged in the recent results.
Next Steps
Don't just look at this quarter; the real story is in the long-term trend. We've done an in-depth analysis on Chain Bridge Bancorp's growth and its valuation to see if today's price is a bargain. Add the company to your watchlist or portfolio now so you don't miss the next big move.
See What Else Is Out There
Chain Bridge Bancorp pairs modest revenue and EPS growth with tighter margins and a P/E that sits only slightly away from broader US bank peers.
If you prefer ideas with stronger recent earnings momentum instead of this slower profile, consider reviewing CTA_SCREENER_LARGE_CAP_HIGH_GROWTH_POTENTIAL to focus on companies that currently appear to have clearer growth potential.
This article by Simply Wall St is general in nature. We provide commentary based on historical data and analyst forecasts only using an unbiased methodology and our articles are not intended to be financial advice. It does not constitute a recommendation to buy or sell any stock, and does not take account of your objectives, or your financial situation. We aim to bring you long-term focused analysis driven by fundamental data. Note that our analysis may not factor in the latest price-sensitive company announcements or qualitative material. Simply Wall St has no position in any stocks mentioned.
Have feedback on this article? Concerned about the content? Get in touch with us directly. Alternatively, email editorial-team@simplywallst.com