
- LIVE QUOTES
- LEARN
- HELP
 Nasdaq
 Wall Street Journal
EN
Is It Too Late To Consider SolarEdge Technologies (SEDG) After Its Sharp One-Year Rebound?
- If you are wondering whether SolarEdge Technologies is still priced attractively after a rough few years, this article will walk through what the current share price might be implying about its value.
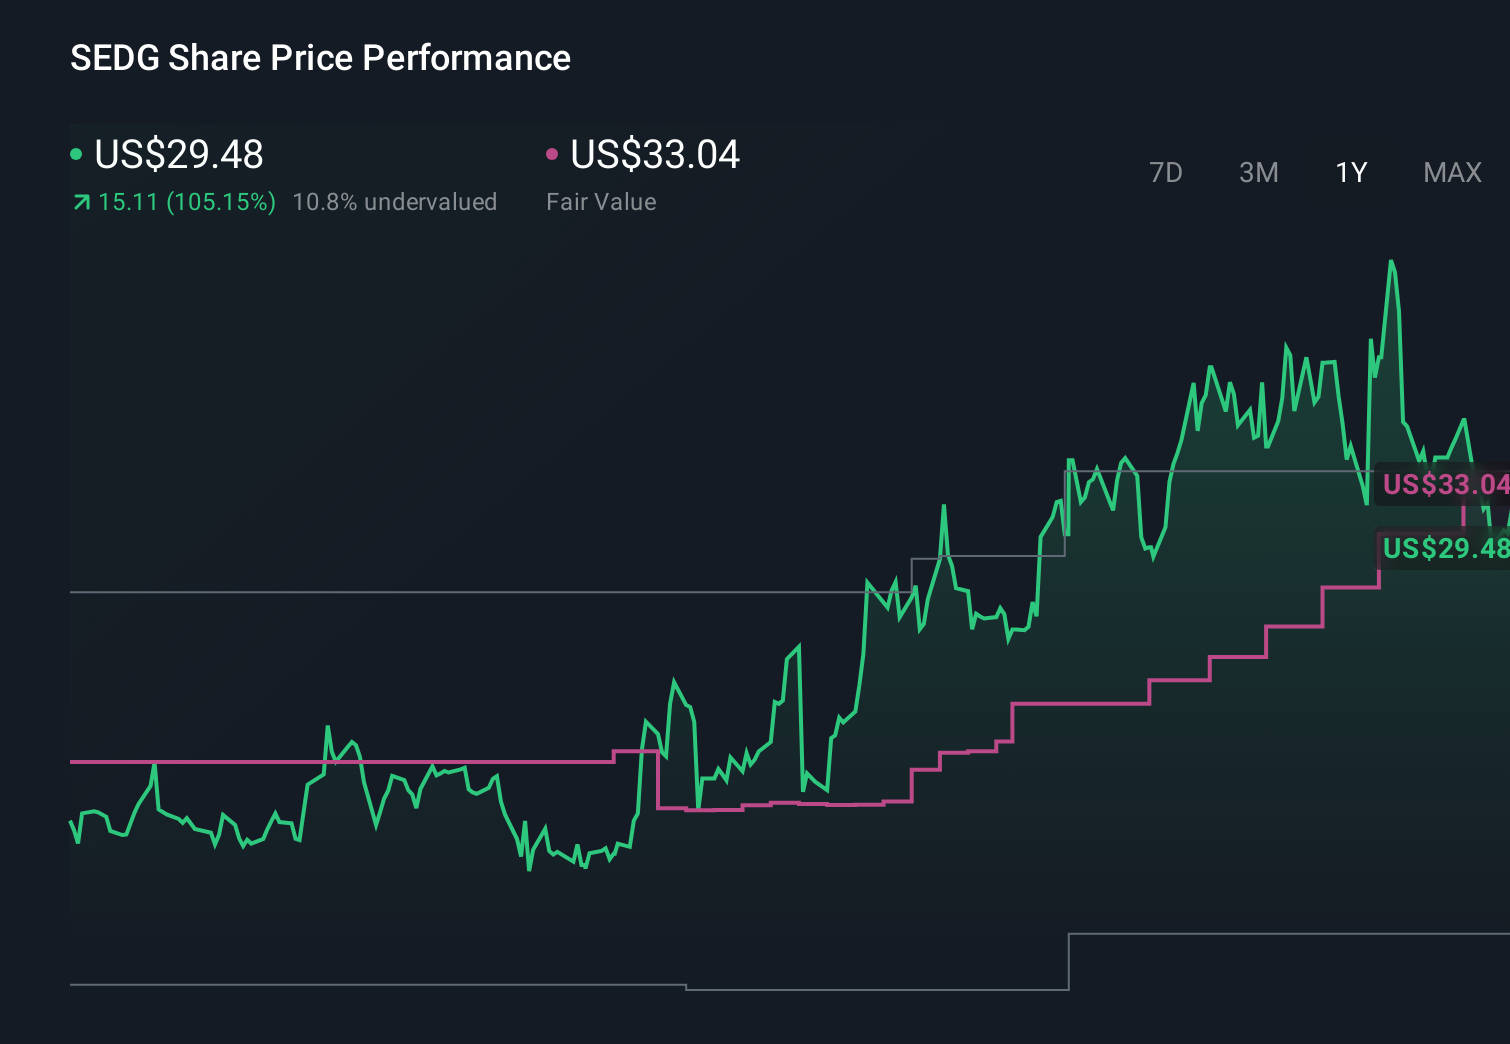
- At a last close of US$35.80, the stock shows returns of 7.4% over 7 days, 22.6% over 30 days, 14.2% year to date and 176.2% over 1 year, compared with longer term returns of 89.1% over 3 years and 88.3% over 5 years.
- Recent news coverage around SolarEdge has focused on its position in the solar equipment space and ongoing interest in companies tied to renewable energy. This helps frame how investors are thinking about future prospects and risk and provides context to the sharp contrast between the shorter term share price performance and the weaker multi year record.
- Simply Wall St currently assigns SolarEdge a valuation score of 2 out of 6, based on how it screens across several valuation checks. Next, we will walk through those methods before finishing with a way to think about value that goes beyond the usual ratios.
SolarEdge Technologies scores just 2/6 on our valuation checks. See what other red flags we found in the full valuation breakdown.
Approach 1: SolarEdge Technologies Discounted Cash Flow (DCF) Analysis
The Discounted Cash Flow, or DCF, model estimates what a company might be worth by projecting its future cash flows and then discounting those back to today using a required rate of return.
For SolarEdge Technologies, the model used is a 2 Stage Free Cash Flow to Equity approach, based on cash flow projections in $. The latest twelve month free cash flow is about $22.9 million. Analysts provide explicit forecasts for the next few years and, beyond that, Simply Wall St extrapolates further, with projected free cash flow of $216.0 million in 2030. Between 2026 and 2035, the projections range from $125.0 million to about $199.5 million before discounting, with each year’s figure brought back to today using a discount rate.
Adding up all these discounted cash flows results in an estimated intrinsic value of about $22.39 per share, compared with the recent share price of US$35.80. On this basis, the DCF output suggests the stock is around 59.9% above the model estimate of value, so the shares screen as overvalued using this method alone.
Result: OVERVALUED
Our Discounted Cash Flow (DCF) analysis suggests SolarEdge Technologies may be overvalued by 59.9%. Discover 880 undervalued stocks or create your own screener to find better value opportunities.
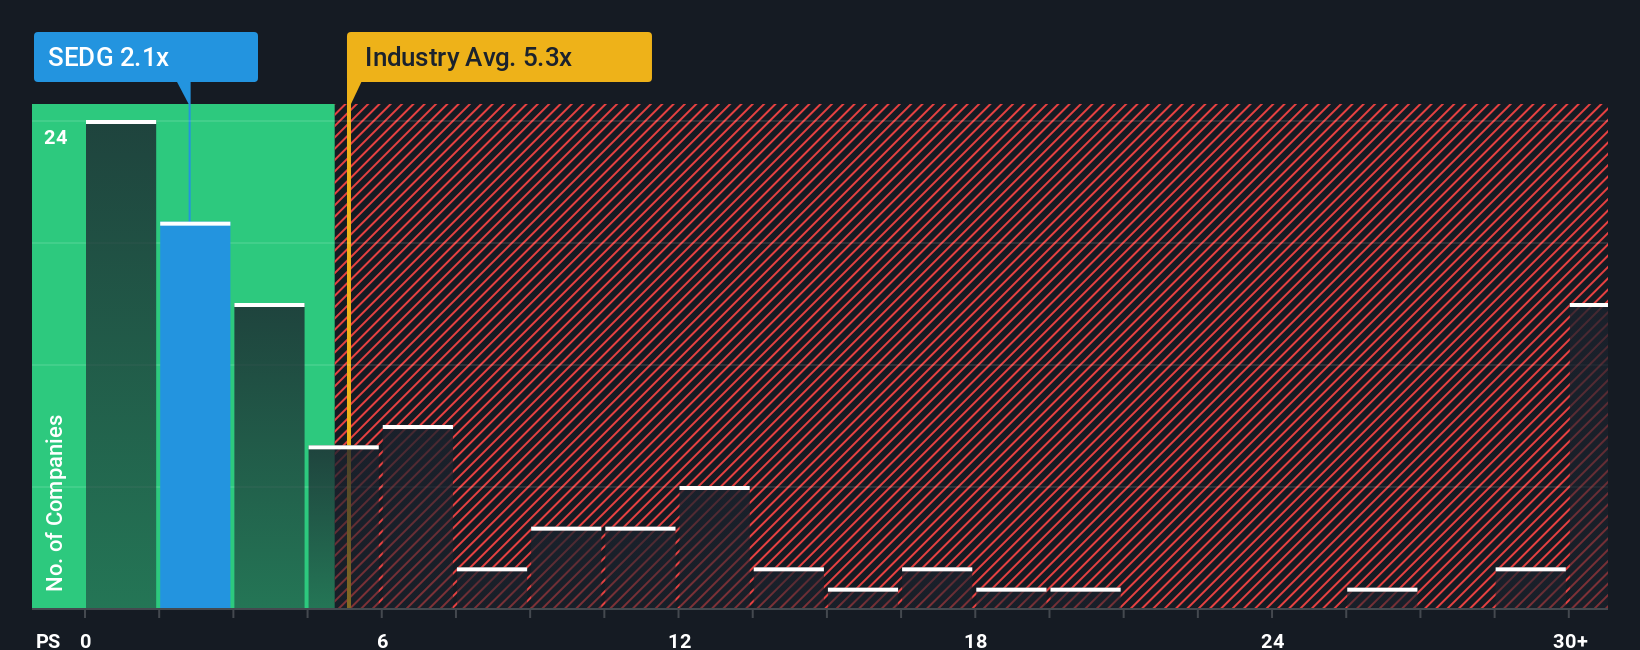
Approach 2: SolarEdge Technologies Price vs Sales
For SolarEdge Technologies, Simply Wall St uses the Price to Sales, or P/S, ratio as the preferred multiple, which is often useful when a company’s earnings are limited or volatile but it is still generating revenue. Investors tend to pay a higher or lower P/S based on their expectations for future growth and how much risk they see in the business, so what counts as a “normal” ratio can vary quite a bit.
SolarEdge currently trades on a P/S of 2.05x. That is below the Semiconductor industry average P/S of 5.74x and also below the peer group average of 2.90x. Simply Wall St’s Fair Ratio for SolarEdge is 1.87x, which is the P/S level it estimates could be reasonable after considering factors such as earnings growth, industry, profit margin, market cap and company specific risks.
This Fair Ratio can be more tailored than a simple comparison with peers or the industry, because it adjusts for the company’s own characteristics rather than assuming all Semiconductor stocks should trade at the same level. Comparing 2.05x with the Fair Ratio of 1.87x suggests the shares screen as slightly overvalued on this metric.
Result: OVERVALUED
P/S ratios tell one story, but what if the real opportunity lies elsewhere? Discover 1421 companies where insiders are betting big on explosive growth.
Upgrade Your Decision Making: Choose your SolarEdge Technologies Narrative
Earlier we mentioned that there is an even better way to understand valuation, so let us introduce you to Narratives. These are simply your story about a company, linked directly to your assumptions for its future revenue, earnings, margins and fair value.
On Simply Wall St, a Narrative connects three things: what you believe about the business, the forecast that follows from that belief and the fair value that follows from those numbers, so you can see how your view translates into a price.
You can create and explore Narratives on the Community page, where millions of investors share their views, compare fair value to the current share price and use that gap to help decide whether a stock might be too expensive or attractively priced.
Because Narratives are updated when new information such as earnings or news is added, your fair value view for SolarEdge Technologies can adjust automatically. You might see one investor expecting strong revenue and margin improvement that supports a much higher fair value, while another assumes more modest progress and arrives at a far lower figure.
Do you think there's more to the story for SolarEdge Technologies? Head over to our Community to see what others are saying!
This article by Simply Wall St is general in nature. We provide commentary based on historical data and analyst forecasts only using an unbiased methodology and our articles are not intended to be financial advice. It does not constitute a recommendation to buy or sell any stock, and does not take account of your objectives, or your financial situation. We aim to bring you long-term focused analysis driven by fundamental data. Note that our analysis may not factor in the latest price-sensitive company announcements or qualitative material. Simply Wall St has no position in any stocks mentioned.
Have feedback on this article? Concerned about the content? Get in touch with us directly. Alternatively, email editorial-team@simplywallst.com