
- LIVE QUOTES
- LEARN
- HELP
 Nasdaq
 Wall Street Journal
EN
A Look At M/I Homes (MHO) Valuation As Analyst Targets Diverge From DCF Estimates
How M/I Homes stock has been trading recently
M/I Homes (MHO) has seen mixed share performance recently, with a 2.9% gain over the past day, a 4.3% decline over the past week, and modest positive returns over the past month and past 3 months.
See our latest analysis for M/I Homes.
That short term share price pullback over the past week comes after a steadier pattern, with a 90 day share price return of 4.8% and a three year total shareholder return of about 2.2x. This points to momentum that has cooled recently but remains meaningful over the longer stretch.
If M/I Homes has you looking closer at housing related names, this could be a good moment to broaden your search and check out fast growing stocks with high insider ownership.
With M/I Homes trading at $132.36, showing modest 1-year and stronger multi-year returns, and analysts setting a $157 price target that suggests potential upside, the key question is whether this represents a genuine value gap or whether the market is already pricing in future growth.
Most Popular Narrative: 15.7% Undervalued
With M/I Homes last closing at $132.36 against a narrative fair value of $157, the prevailing view is that the current price sits at a discount.
The analysts have a consensus price target of $162.0 for M/I Homes based on their expectations of its future earnings growth, profit margins and other risk factors. However, there is a degree of disagreement amongst analysts, with the most bullish reporting a price target of $185.0, and the most bearish reporting a price target of just $150.0.
Curious what drives a higher fair value when earnings are expected to soften and revenue trends are flat to declining? The narrative leans heavily on margin assumptions, valuation multiples and buybacks. The mix between pricing power and future P/E expectations is doing a lot of work here.
Based on this most followed narrative, which uses a 9.20% discount rate, M/I Homes screens as undervalued by 15.7% relative to an internal fair value estimate of $157 per share at a last close of $132.36.
Result: Fair Value of $157 (UNDERVALUED)
Have a read of the narrative in full and understand what's behind the forecasts.
However, there are clear pressure points to watch, including softer new contracts and margin strain from mortgage rate buydowns and higher inventory exposure, which could challenge this undervalued thesis.
Find out about the key risks to this M/I Homes narrative.
Another Way To Look At M/I Homes
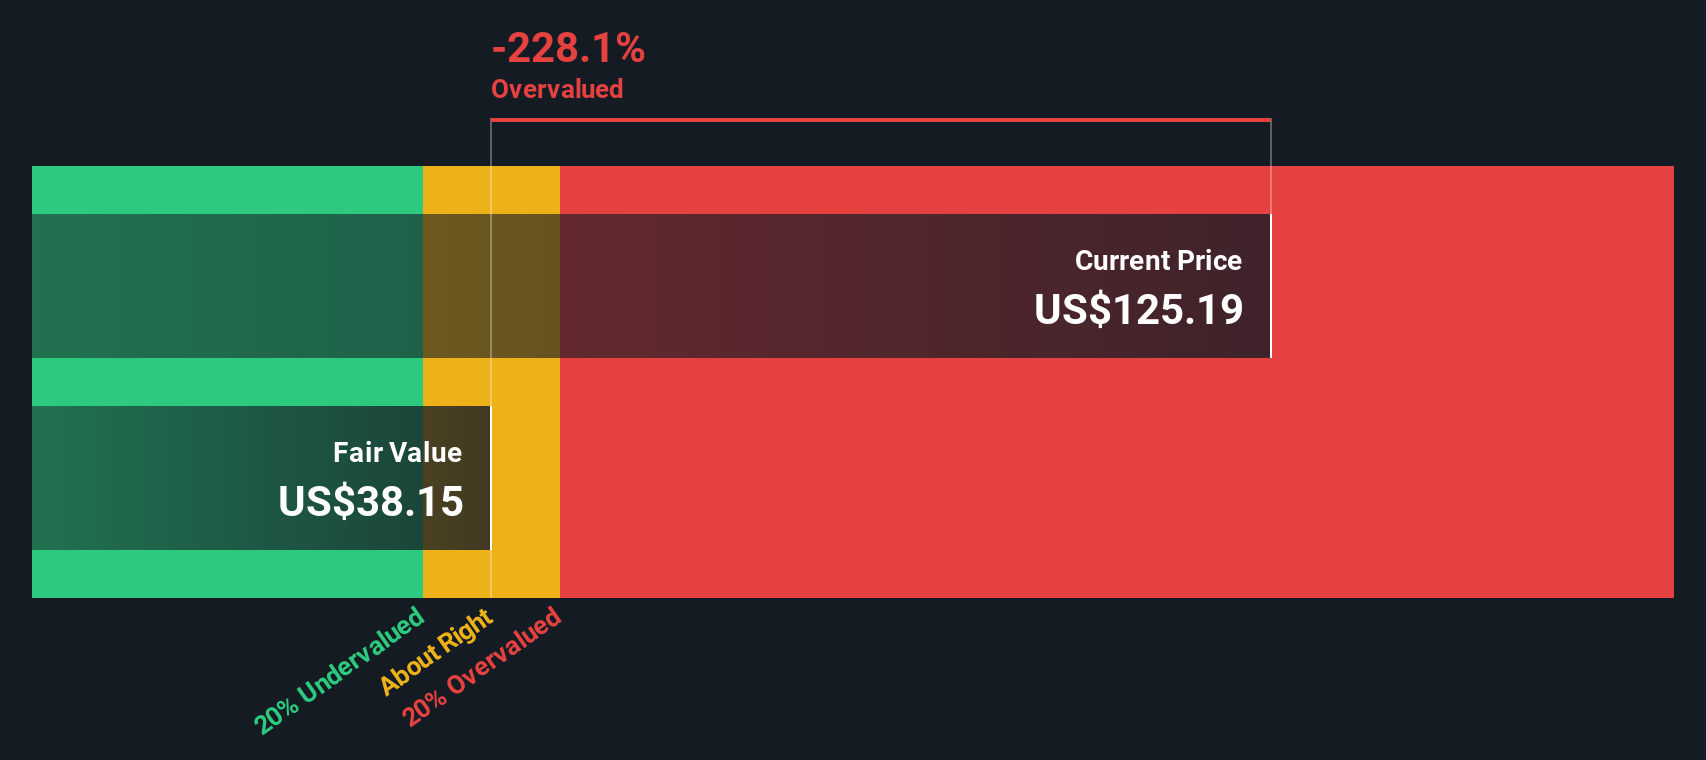
Our DCF model paints a very different picture to the 15.7% undervalued narrative. On this view, M/I Homes at $132.36 is trading well above an estimated future cash flow value of $37.92, which points to a wide gap between cash flow assumptions and the current share price. Which version of value do you put more weight on?
Look into how the SWS DCF model arrives at its fair value.
Simply Wall St performs a discounted cash flow (DCF) on every stock in the world every day (check out M/I Homes for example). We show the entire calculation in full. You can track the result in your watchlist or portfolio and be alerted when this changes, or use our stock screener to discover 879 undervalued stocks based on their cash flows. If you save a screener we even alert you when new companies match - so you never miss a potential opportunity.
Build Your Own M/I Homes Narrative
If you see things differently or prefer to weigh the numbers yourself, you can piece together your own view in just a few minutes. Do it your way.
A great starting point for your M/I Homes research is our analysis highlighting 2 key rewards and 1 important warning sign that could impact your investment decision.
Looking for more investment ideas?
If M/I Homes has sharpened your focus, do not stop here. Use this momentum to broaden your watchlist with other focused stock ideas on Simply Wall Street.
- Hunt for growth potential in smaller names by checking out these 3523 penny stocks with strong financials, which pair share price accessibility with stronger financial profiles.
- Position yourself in the AI trend by scanning these 24 AI penny stocks, which tie artificial intelligence themes to listed companies across sectors.
- Target value minded opportunities by reviewing these 879 undervalued stocks based on cash flows, which screen for stocks trading below estimated cash flow value.
This article by Simply Wall St is general in nature. We provide commentary based on historical data and analyst forecasts only using an unbiased methodology and our articles are not intended to be financial advice. It does not constitute a recommendation to buy or sell any stock, and does not take account of your objectives, or your financial situation. We aim to bring you long-term focused analysis driven by fundamental data. Note that our analysis may not factor in the latest price-sensitive company announcements or qualitative material. Simply Wall St has no position in any stocks mentioned.
Have feedback on this article? Concerned about the content? Get in touch with us directly. Alternatively, email editorial-team@simplywallst.com