
- LIVE QUOTES
- LEARN
- HELP
 Nasdaq
 Wall Street Journal
EN
Is ACI Worldwide (ACIW) Offering Value After Recent Share Price Weakness?
- If you are wondering whether ACI Worldwide at around US$43.50 is a bargain or a value trap, you are in the right place to size up what the current price actually reflects.
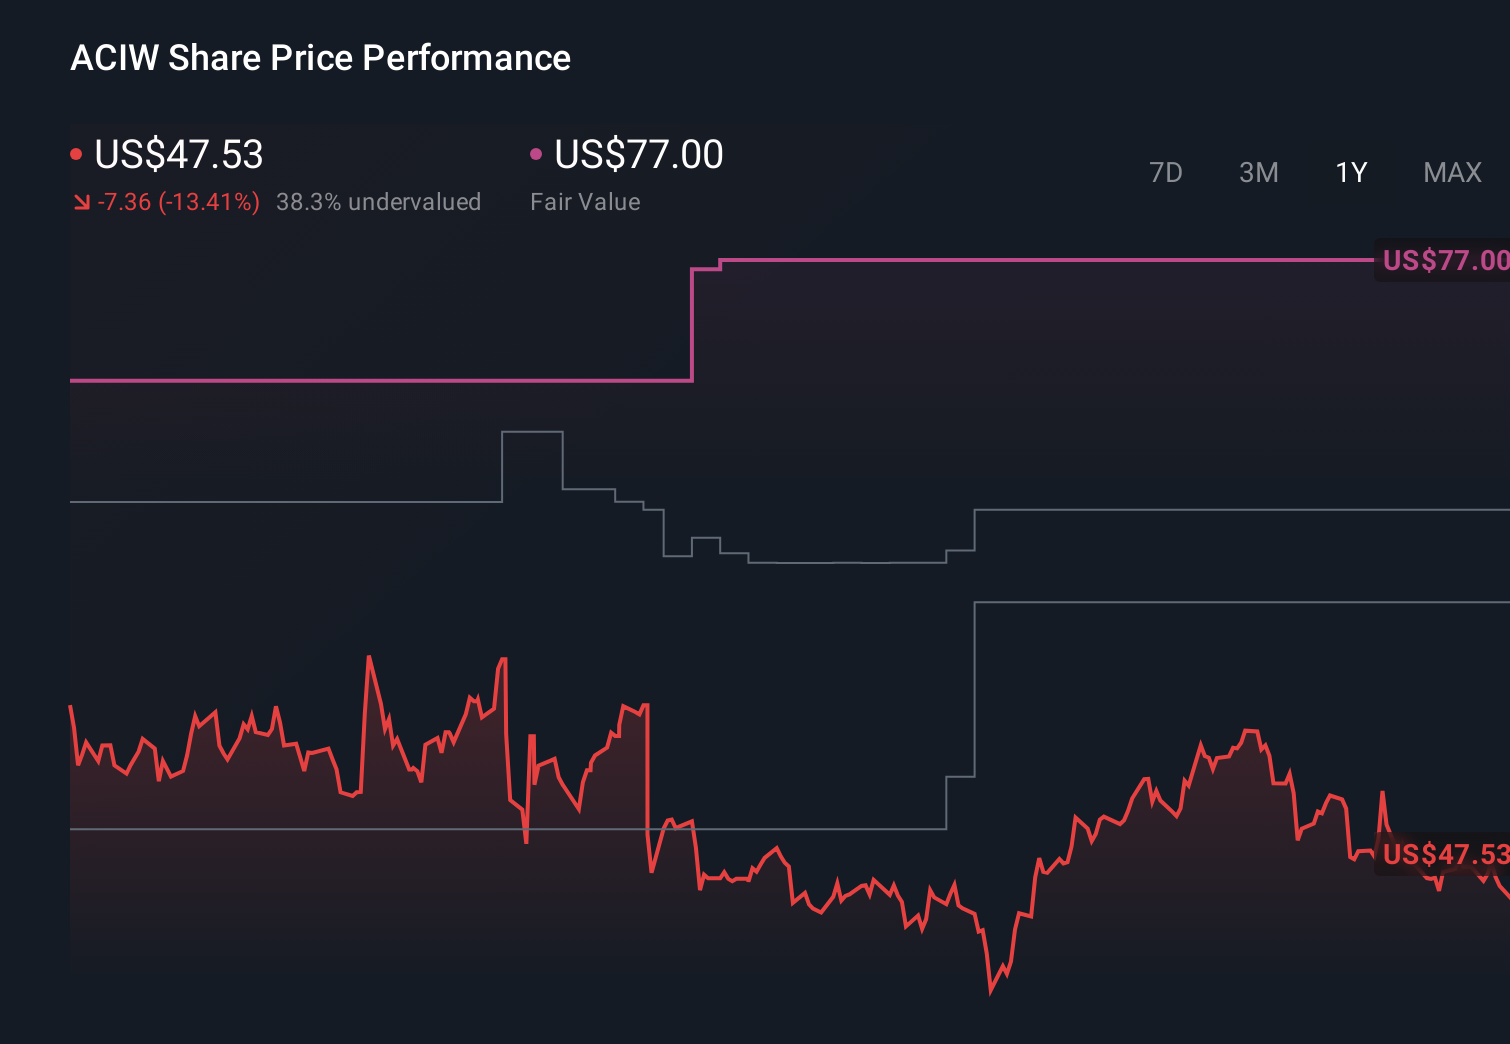
- The stock has had a mixed run, with a 1.4% gain over the last 7 days, a 10.5% decline over 30 days, a 4.8% decline year to date, and a 19.0% decline over 1 year, while still sitting on a 54.3% return over 3 years and 9.7% over 5 years.
- Recent news around ACI Worldwide has focused on its role in electronic payments and software for banks and merchants. This keeps investor attention on how its transaction volumes and customer relationships might influence long term expectations. At the same time, broader conversations about digital payments companies have kept valuation metrics, competitive positioning, and capital allocation choices in the spotlight for stocks like ACI Worldwide.
- Against that backdrop, ACI Worldwide currently scores 6/6 on our valuation checks. Next we will look at how different methods such as earnings based multiples and cash flow models line up on price, before finishing with a simple way to pull all those valuation angles together.
Find out why ACI Worldwide's -19.0% return over the last year is lagging behind its peers.
Approach 1: ACI Worldwide Discounted Cash Flow (DCF) Analysis
A Discounted Cash Flow, or DCF, model takes estimates of the cash a business could generate in the future and discounts those cash flows back to today to arrive at an estimated intrinsic value per share.
For ACI Worldwide, the model used is a 2 Stage Free Cash Flow to Equity approach based on cash flow projections. The latest twelve month Free Cash Flow is about $283.1 million, and analysts provide explicit forecasts out to 2027, where Free Cash Flow is projected at $374.2 million. Beyond that, Simply Wall St extrapolates the company’s cash flows out to 2035, with discounted values supplied for each year in the 10 year projection window.
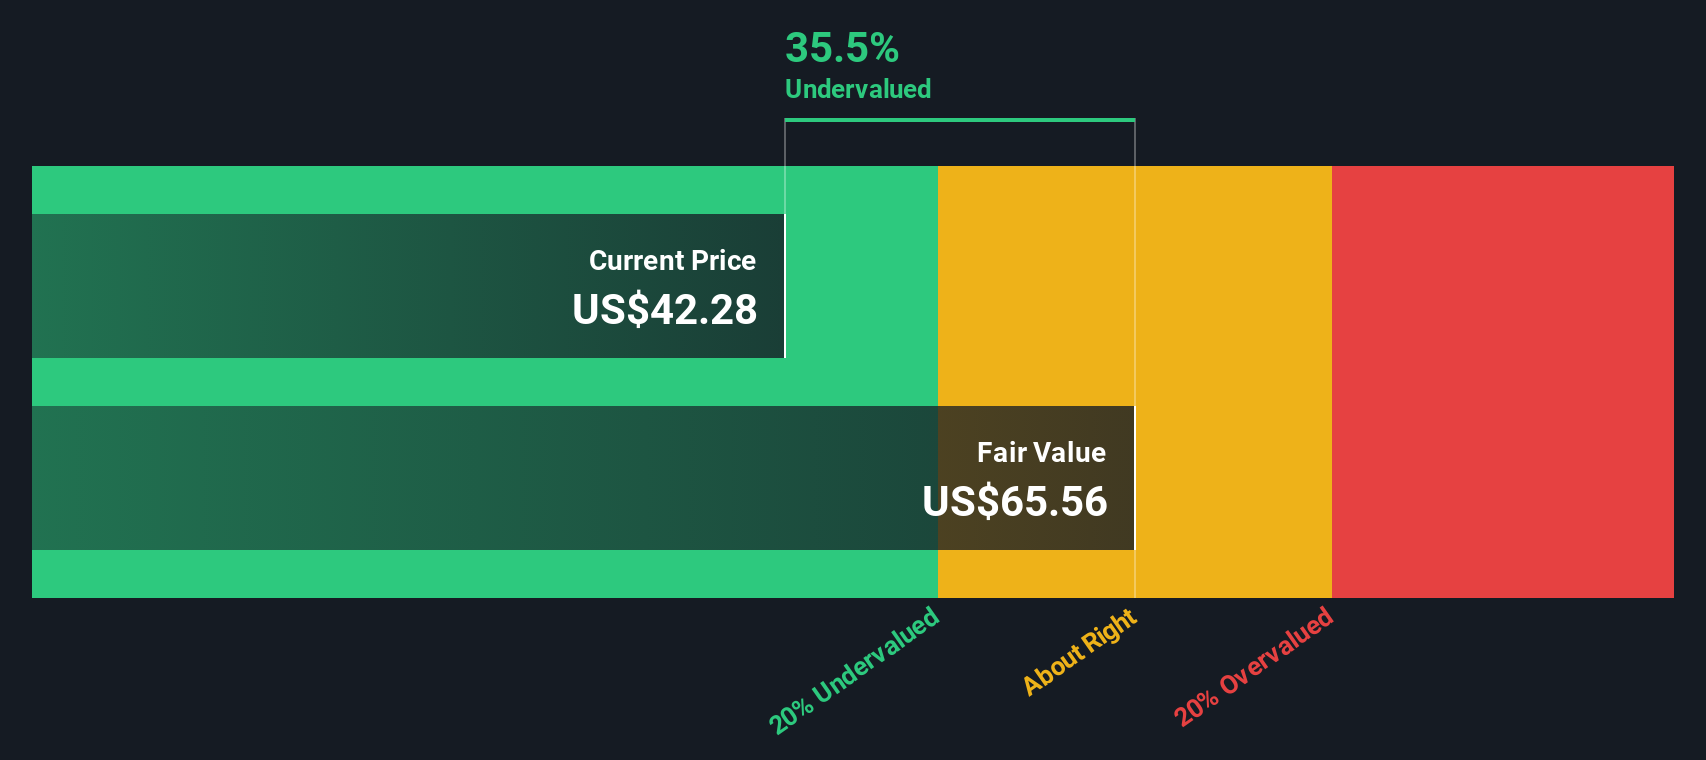
Pulling those discounted cash flows together, the DCF model arrives at an estimated intrinsic value of about $64.05 per share. Compared with a current share price around $43.50, this implies the stock trades at roughly a 32.1% discount to that intrinsic value. On this DCF view, ACI Worldwide appears to be undervalued.
Result: UNDERVALUED
Our Discounted Cash Flow (DCF) analysis suggests ACI Worldwide is undervalued by 32.1%. Track this in your watchlist or portfolio, or discover 880 more undervalued stocks based on cash flows.
Approach 2: ACI Worldwide Price vs Earnings
For a profitable business like ACI Worldwide, the P/E ratio is a useful way to think about what you are paying for each dollar of earnings. It connects directly to the company’s bottom line, which is what ultimately supports shareholder returns over time.
What counts as a “normal” P/E depends on how the market views a company’s growth prospects and risk profile. Higher expected growth and lower perceived risk usually support a higher P/E, while slower growth or higher risk typically point to a lower one.
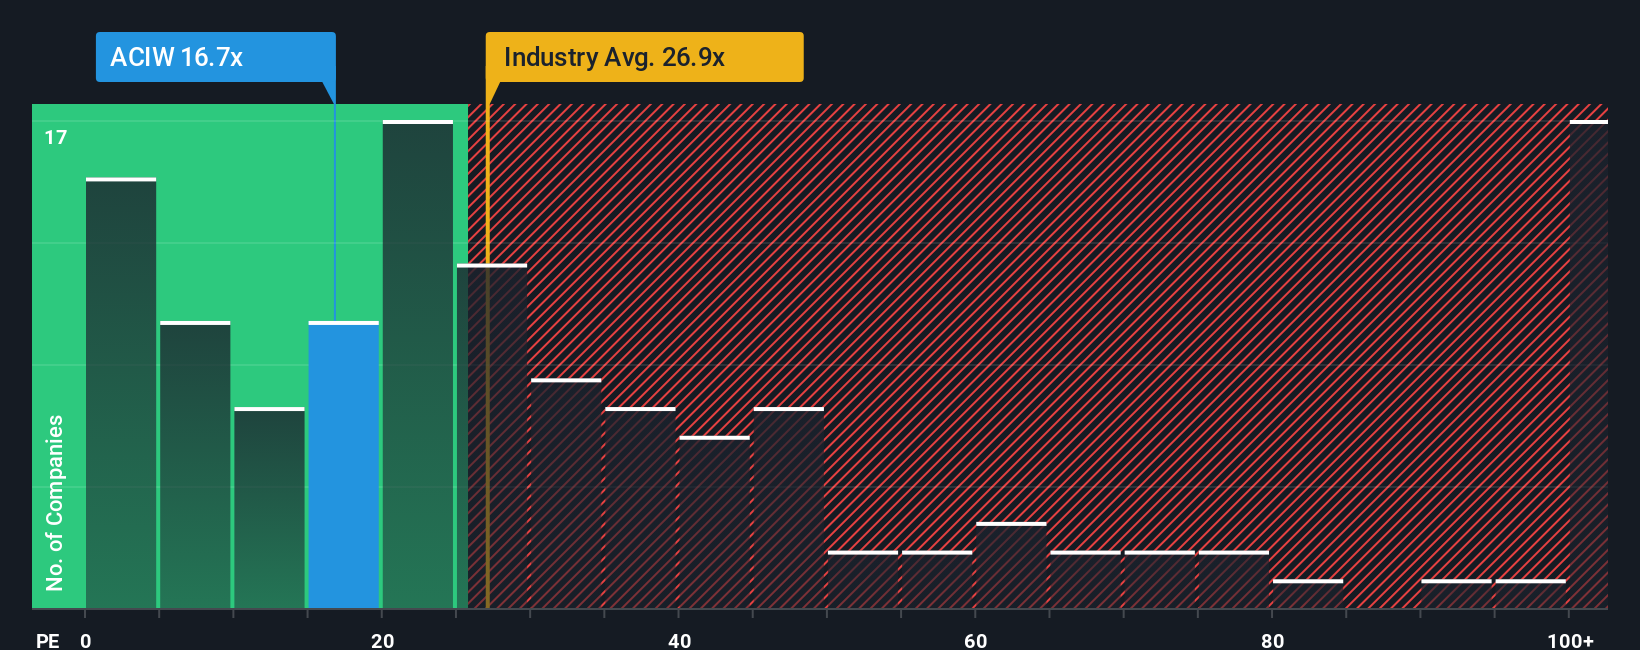
ACI Worldwide currently trades on a P/E of 17.19x, compared with the broader Software industry average of about 30.13x and a peer average of 60.10x. Simply Wall St’s Fair Ratio for ACI Worldwide is 25.07x. This is its proprietary estimate of a suitable P/E given factors such as earnings growth, profit margins, industry, market value and company specific risks. This Fair Ratio can be more useful than a simple comparison to peers or the industry, because it adjusts for the company’s own characteristics rather than assuming all software names deserve the same multiple. On this basis, ACI Worldwide’s current 17.19x P/E sits below the 25.07x Fair Ratio, which indicates that the shares may be undervalued on an earnings basis.
Result: UNDERVALUED
P/E ratios tell one story, but what if the real opportunity lies elsewhere? Discover 1419 companies where insiders are betting big on explosive growth.
Upgrade Your Decision Making: Choose your ACI Worldwide Narrative
Earlier we mentioned that there is an even better way to understand valuation, so let us introduce you to Narratives, a simple way to connect your view of ACI Worldwide’s business to the numbers you see on screen.
A Narrative is your story about the company, where you spell out what you expect for future revenue, earnings and margins, and link that to an assumed fair value instead of relying only on headline ratios like the P/E.
On Simply Wall St, Narratives live in the Community page and are designed to be easy to use. This means you can quickly compare your Fair Value to the current share price, see whether that points you toward buying, holding or selling, and then watch your view update automatically as new earnings, news or other data is added.
For ACI Worldwide, one investor might build a Narrative that assumes stronger transaction growth and assigns a higher fair value than another investor who focuses more on competition risk and arrives at a lower fair value. This shows how the same company can support quite different, but well structured, viewpoints.
Do you think there's more to the story for ACI Worldwide? Head over to our Community to see what others are saying!
This article by Simply Wall St is general in nature. We provide commentary based on historical data and analyst forecasts only using an unbiased methodology and our articles are not intended to be financial advice. It does not constitute a recommendation to buy or sell any stock, and does not take account of your objectives, or your financial situation. We aim to bring you long-term focused analysis driven by fundamental data. Note that our analysis may not factor in the latest price-sensitive company announcements or qualitative material. Simply Wall St has no position in any stocks mentioned.
Have feedback on this article? Concerned about the content? Get in touch with us directly. Alternatively, email editorial-team@simplywallst.com