
- LIVE QUOTES
- LEARN
- HELP
 Nasdaq
 Wall Street Journal
EN
Is Sprinklr (CXM) Offering Value After Recent Share Price Weakness
- If you are wondering whether Sprinklr’s current share price really reflects what the business is worth, you are not alone. This article is here to unpack that question in a clear, practical way.
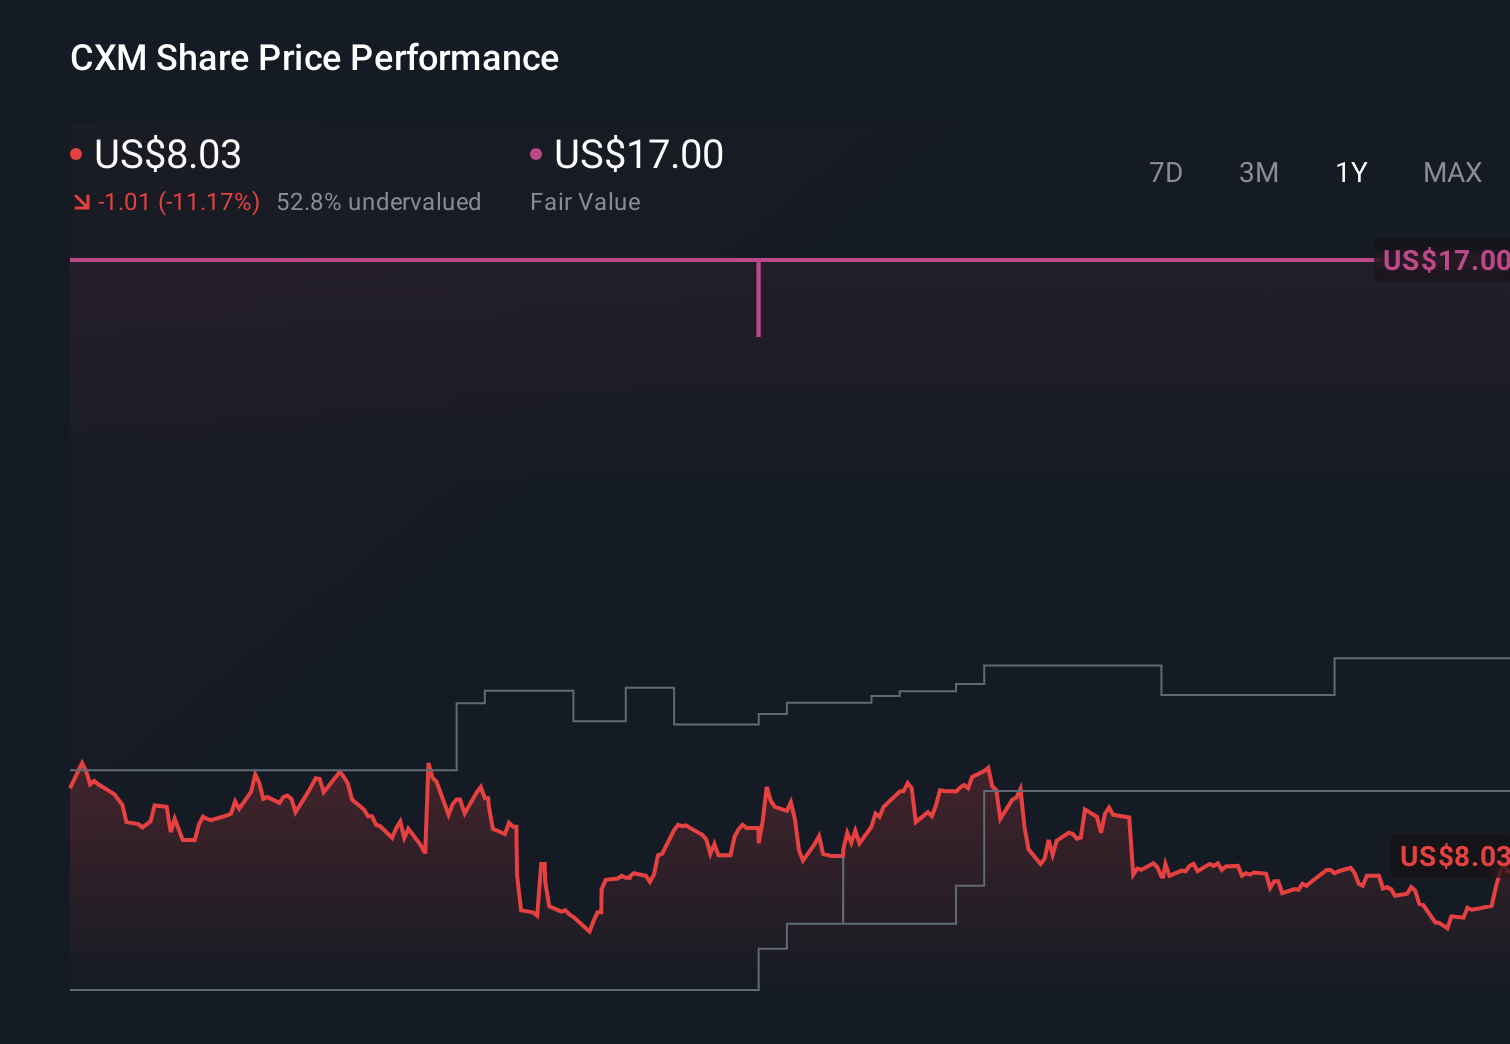
- Sprinklr recently closed at US$6.56, with share price returns of a 0.8% decline over 7 days, a 15.0% decline over 30 days, a 10.4% decline year to date, and a 29.1% decline over 1 year. These moves may have some investors reassessing both its potential and its risks.
- Recent coverage of Sprinklr has focused on its role as a customer experience software provider and how market sentiment has shifted around many software names, with investors paying closer attention to business quality and pricing. This backdrop helps explain why the share price has been under pressure, even as interest in software and AI related themes remains high.
- On our checks, Sprinklr currently has a valuation score of 4 out of 6. We will break this down using several common approaches, before finishing with a different way of thinking about valuation that can give you a more complete picture.
Find out why Sprinklr's -29.1% return over the last year is lagging behind its peers.
Approach 1: Sprinklr Discounted Cash Flow (DCF) Analysis
A DCF model takes estimates of the cash a company could generate in the future, then discounts those cash flows back to today to arrive at an estimate of what the business might be worth now.
For Sprinklr, the model used is a 2 Stage Free Cash Flow to Equity approach, based on cash flows in US$. The latest twelve month free cash flow sits at about US$123.2 million. Analysts have specific projections out to 2028, with free cash flow for that year at US$146.36 million, and Simply Wall St extrapolates further projections out to 2035 using its own assumptions.
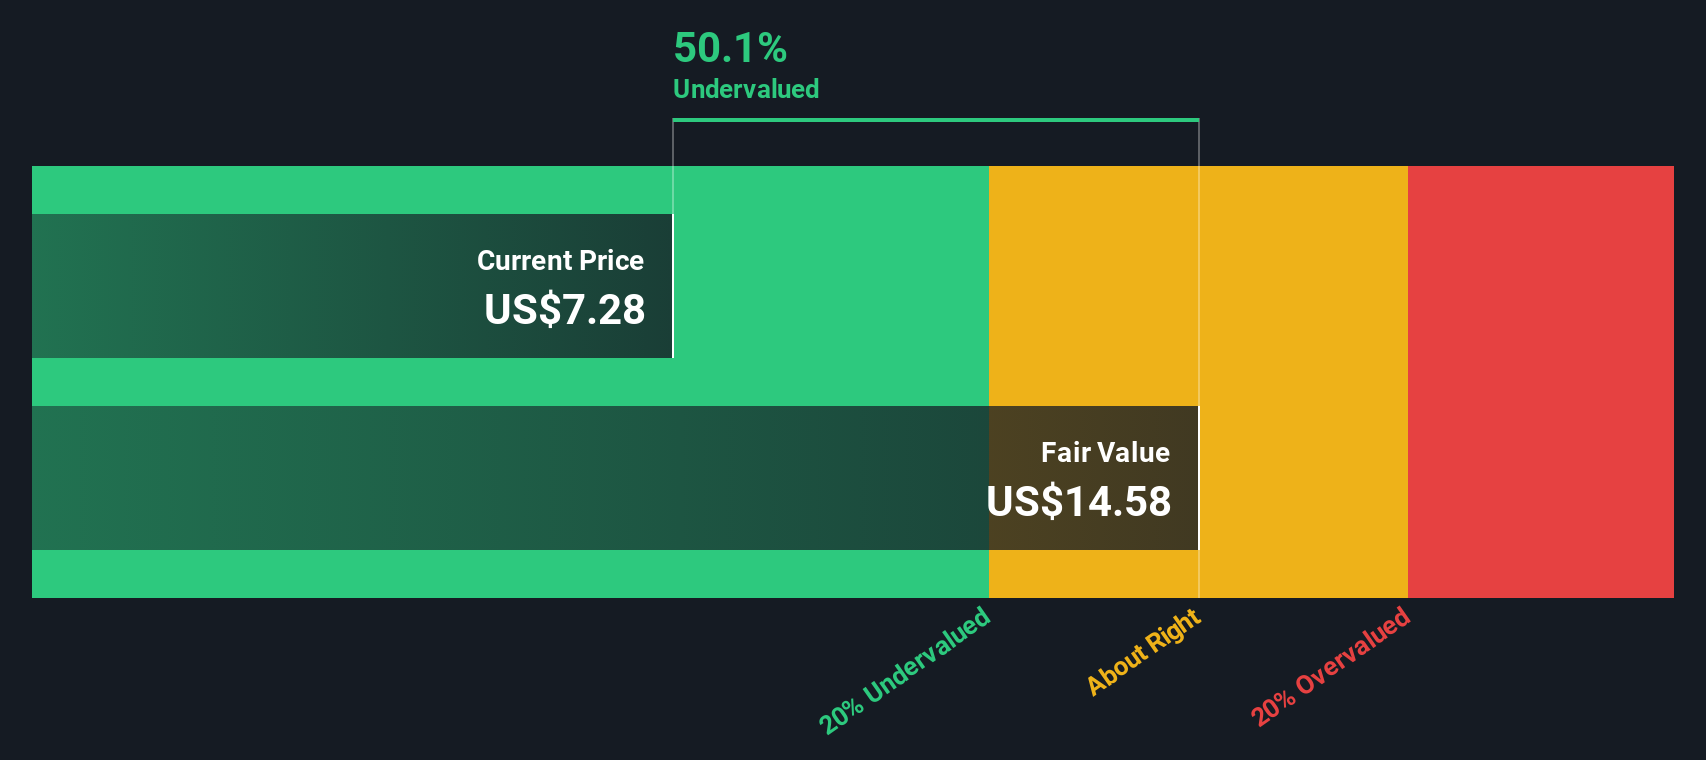
Bringing all of those projected cash flows back to today, the DCF model arrives at an estimated intrinsic value of US$11.33 per share. Compared with the recent share price of US$6.56, this implies the stock is trading at a 42.1% discount to that DCF value. On this framework, Sprinklr appears to be trading below that estimated intrinsic value.
Result: UNDERVALUED
Our Discounted Cash Flow (DCF) analysis suggests Sprinklr is undervalued by 42.1%. Track this in your watchlist or portfolio, or discover 876 more undervalued stocks based on cash flows.
Approach 2: Sprinklr Price vs Earnings
For a company that is generating earnings, the P/E ratio is a straightforward way to link what you pay per share to what the business is currently earning per share. It helps you see how many dollars of price the market assigns to each dollar of earnings.
What counts as a "normal" P/E ratio usually reflects how investors see the balance between growth potential and risk. Higher expected growth or lower perceived risk can support a higher P/E, while slower expected growth or higher risk tends to line up with a lower P/E.
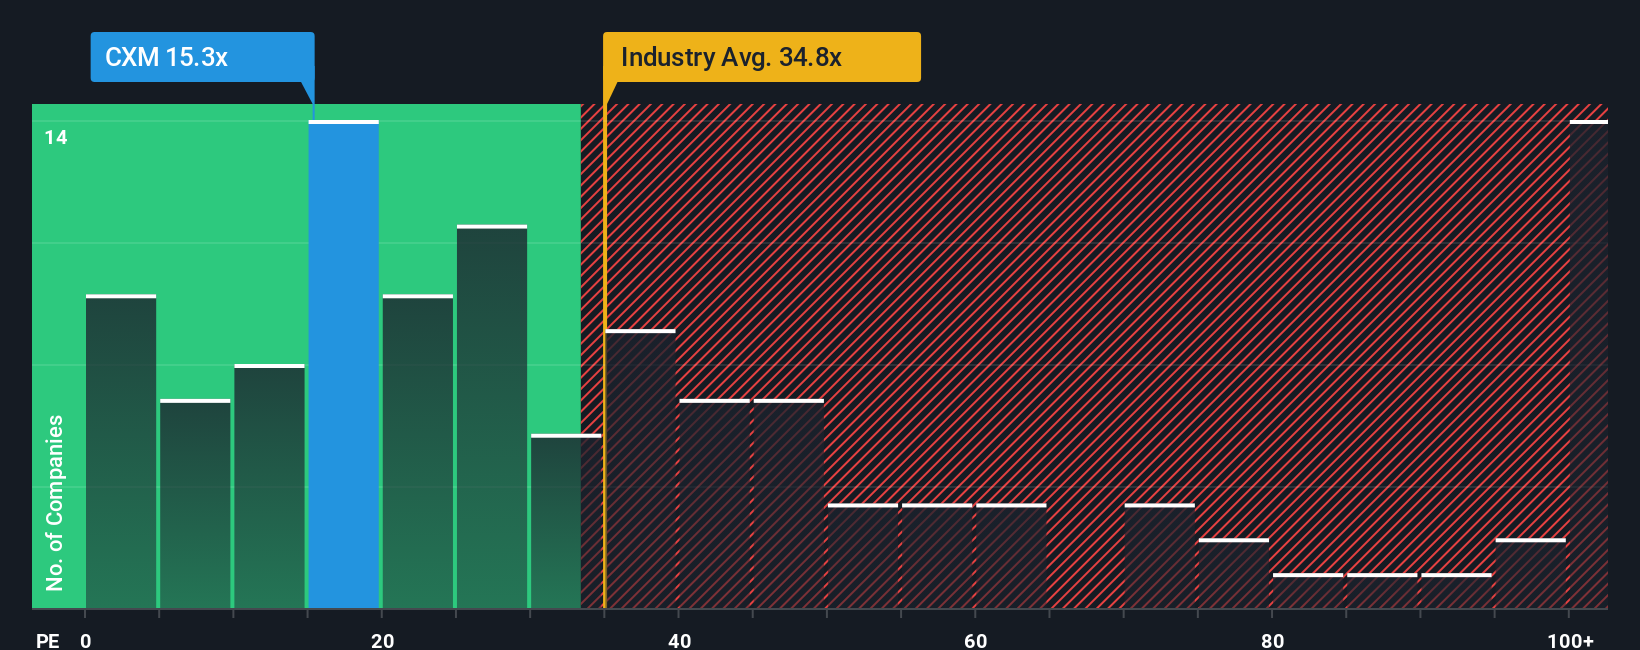
Sprinklr is currently trading on a P/E of 14.37x. That sits below both the Software industry average P/E of 30.41x and the peer group average of 30.17x. Simply Wall St also calculates a proprietary “Fair Ratio” for Sprinklr of 13.93x, which is the P/E level it estimates would be appropriate given factors such as earnings growth, industry, profit margin, market cap and risk profile.
This Fair Ratio can be more useful than a simple industry or peer comparison because it adjusts for company specific characteristics instead of assuming one size fits all. With Sprinklr’s current P/E of 14.37x sitting close to the Fair Ratio of 13.93x, the shares appear priced at about the level this framework would suggest.
Result: ABOUT RIGHT
P/E ratios tell one story, but what if the real opportunity lies elsewhere? Discover 1422 companies where insiders are betting big on explosive growth.
Upgrade Your Decision Making: Choose your Sprinklr Narrative
Earlier we mentioned that there is an even better way to think about valuation. Let us introduce you to Narratives, a simple tool on Simply Wall St’s Community page that lets you attach your own story about Sprinklr to the numbers you care about, such as your view of its fair value and what you think might happen to its future revenue, earnings and margins.
A Narrative links three things in a clear chain: your view of the business, a financial forecast built from that view, and the fair value that forecast implies. You can then compare that with the current share price to help decide whether it looks attractive for your goals.
Because Narratives on Simply Wall St are updated automatically when fresh information such as news or earnings is added, you can see how your thesis on Sprinklr holds up without rebuilding your work each time.
For example, some investors on the platform may see Sprinklr as a higher growth customer experience software opportunity and set a higher fair value. Others may focus more on competitive pressures and assign a lower fair value. Both views can sit side by side as Narratives you can review for yourself.
Do you think there's more to the story for Sprinklr? Head over to our Community to see what others are saying!
This article by Simply Wall St is general in nature. We provide commentary based on historical data and analyst forecasts only using an unbiased methodology and our articles are not intended to be financial advice. It does not constitute a recommendation to buy or sell any stock, and does not take account of your objectives, or your financial situation. We aim to bring you long-term focused analysis driven by fundamental data. Note that our analysis may not factor in the latest price-sensitive company announcements or qualitative material. Simply Wall St has no position in any stocks mentioned.
Have feedback on this article? Concerned about the content? Get in touch with us directly. Alternatively, email editorial-team@simplywallst.com