
- LIVE QUOTES
- LEARN
- HELP
 Nasdaq
 Wall Street Journal
EN
Is Costamare (CMRE) Pricing Reflect Its Strong Five Year Rally And Shipping Sector News
- If you are wondering whether Costamare's current share price reflects its true worth, you are not alone. Many investors are asking the same question.
- Costamare's stock recently closed at US$16.33, with returns of 5.8% over 7 days, 3.9% over 30 days, 4.1% year to date, 98.0% over 1 year, 145.6% over 3 years and 241.2% over 5 years.
- Recent news around the container shipping and broader transportation sector has kept attention on companies like Costamare, as investors weigh supply chain trends, freight demand and charter market conditions. This backdrop helps frame why a stock with this kind of return profile is attracting fresh interest from both new and existing shareholders.
- Simply Wall St currently gives Costamare a valuation score of 2 out of 6, which means it screens as undervalued on 2 of 6 key checks. Next, we will look at what different valuation approaches say about that price, before finishing with a more complete way to think about Costamare's value.
Costamare scores just 2/6 on our valuation checks. See what other red flags we found in the full valuation breakdown.
Approach 1: Costamare Discounted Cash Flow (DCF) Analysis
A Discounted Cash Flow, or DCF, model estimates what a company might be worth by projecting its future cash flows and then discounting those back to today. In this case, the model uses a 2 Stage Free Cash Flow to Equity approach based on Costamare's projected cash generation for shareholders.
Costamare's latest twelve month free cash flow is about $178 million. Analyst input is used for nearer term forecasts, with cash flow of $444 million in 2026 and $230 million in 2027. Simply Wall St then extrapolates the projections further out to 2035. All figures are in US dollars, and because they are below $1b they are discussed in millions.
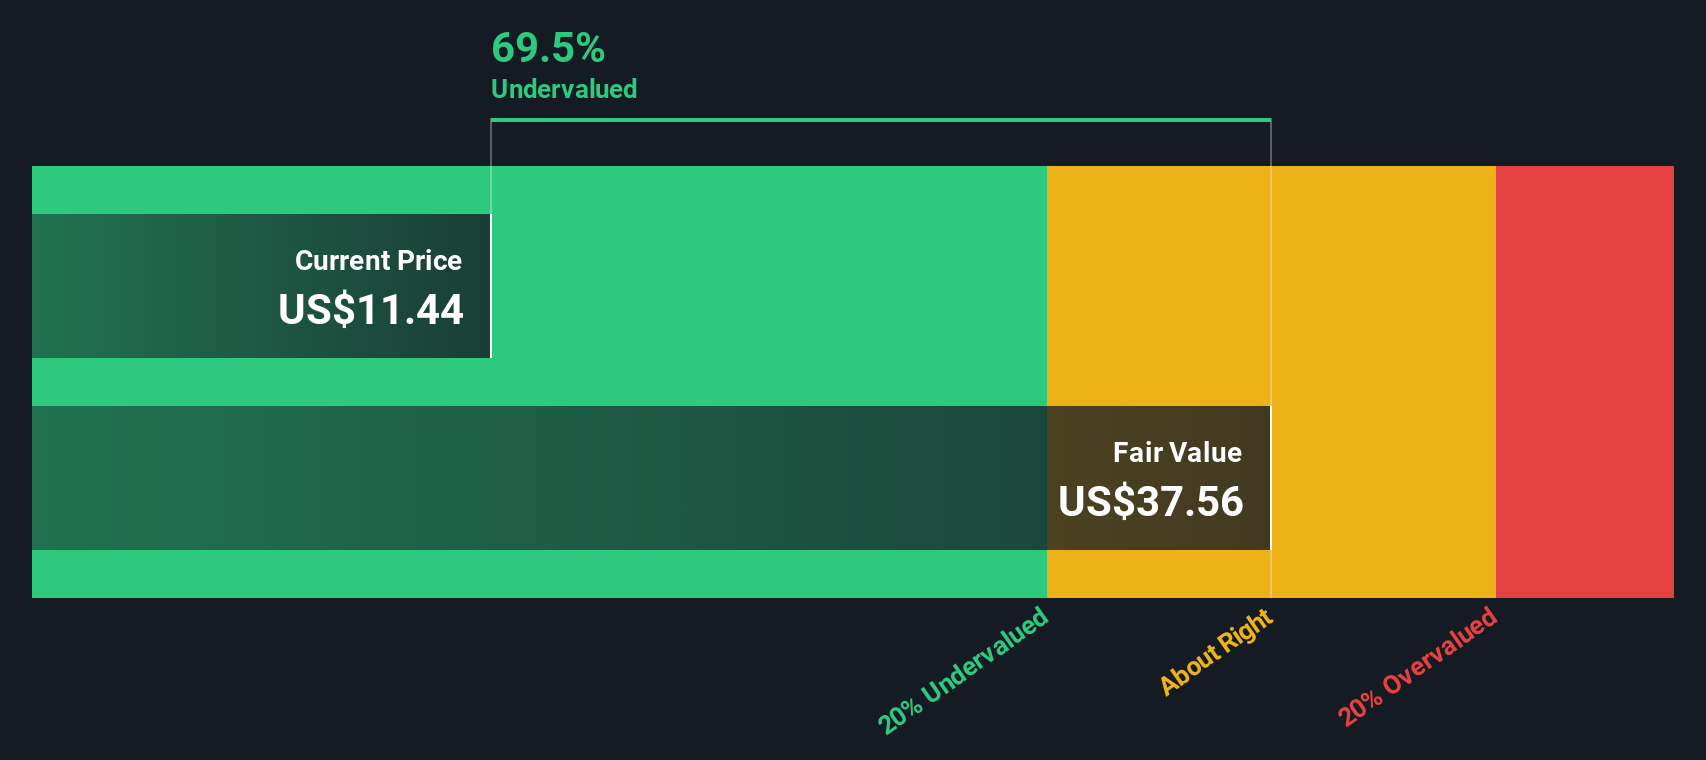
When those projected cash flows are discounted back, the model arrives at an estimated intrinsic value of US$10.03 per share. Compared with the recent share price of US$16.33, this implies the stock is about 62.9% above the DCF estimate, so on this model Costamare screens as overvalued rather than cheap.
Result: OVERVALUED
Our Discounted Cash Flow (DCF) analysis suggests Costamare may be overvalued by 62.9%. Discover 876 undervalued stocks or create your own screener to find better value opportunities.
Approach 2: Costamare Price vs Earnings
For a profitable company like Costamare, the P/E ratio is a useful way to link what you pay for each share with the earnings that support it. In general, higher growth expectations or lower perceived risk can justify a higher P/E, while lower growth or higher risk tends to line up with a lower, more cautious multiple.
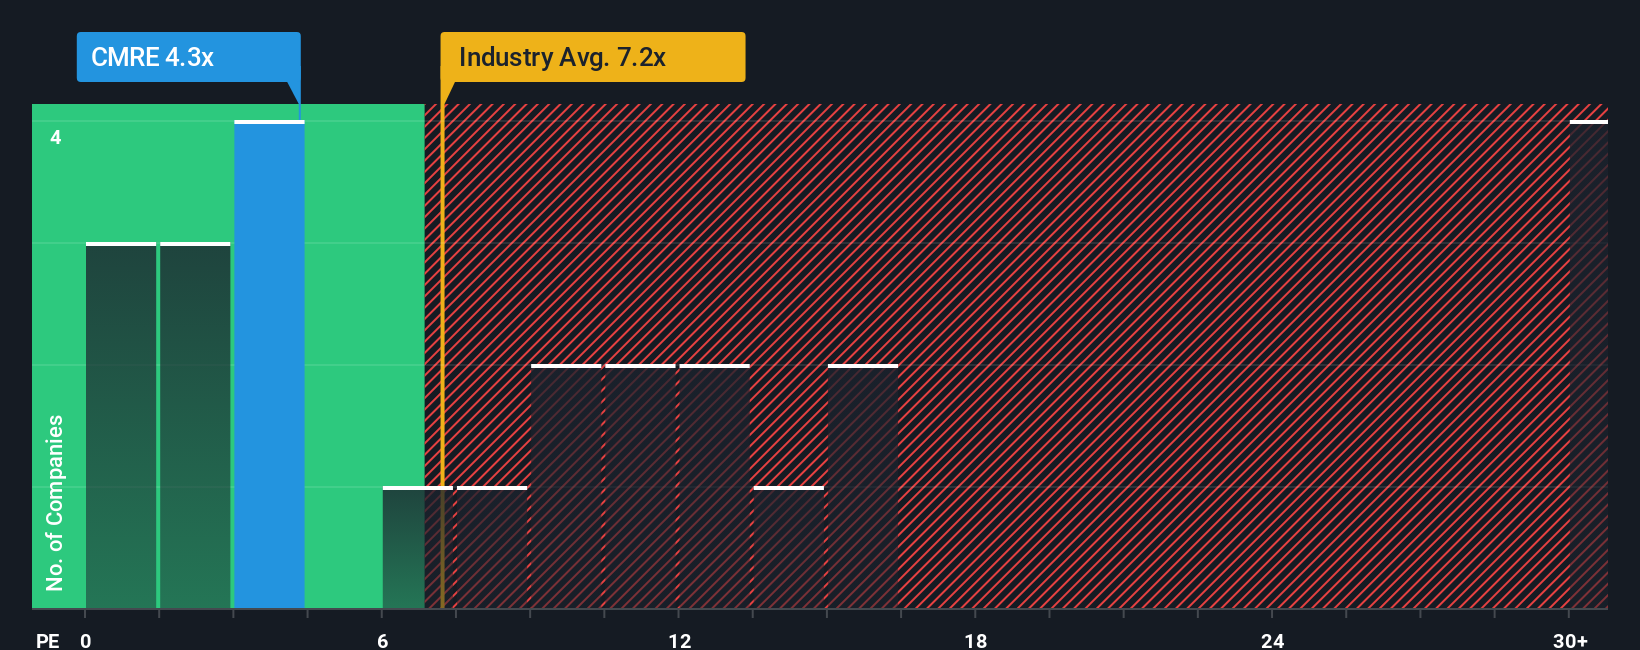
Costamare currently trades on a P/E of 6.56x. That sits above the Shipping industry average of about 10.01x and the peer group average of 5.58x, so simple comparisons send a mixed signal. To add more context, Simply Wall St uses a proprietary “Fair Ratio” of 10.10x for Costamare. This is the P/E level it estimates could be appropriate given factors such as the company’s earnings profile, industry, profit margin, market cap and risk characteristics.
This Fair Ratio is designed to be more tailored than a basic peer or industry comparison because it blends company specific factors with sector and size considerations, rather than relying on broad averages alone. On this basis, Costamare’s actual P/E of 6.56x sits below the Fair Ratio of 10.10x, which indicates that the shares screen as undervalued on this metric.
Result: UNDERVALUED
P/E ratios tell one story, but what if the real opportunity lies elsewhere? Discover 1422 companies where insiders are betting big on explosive growth.
Upgrade Your Decision Making: Choose your Costamare Narrative
Earlier we mentioned that there is an even better way to understand valuation, so let us introduce you to Narratives, which Simply Wall St offers on the Community page used by millions of investors.
A Narrative is simply your story about a company expressed through numbers, where you set your view on future revenue, earnings and margins, and the platform turns that story into a forecast and an implied fair value.
Instead of looking at a P/E or DCF in isolation, a Narrative connects what you believe about Costamare’s business to a financial model. It then directly compares the fair value you arrive at with today’s share price so you can decide whether the stock looks expensive or cheap to you and whether that lines up with your own buy or sell timing.
Because Narratives on Simply Wall St update automatically when new information like earnings or news is added, your story and fair value view stay current without you having to rebuild a spreadsheet. You can see, for example, one Costamare Narrative that assumes a relatively cautious fair value and another that assumes a higher fair value, reflecting different opinions on future shipping demand and charter rates.
Do you think there's more to the story for Costamare? Head over to our Community to see what others are saying!

This article by Simply Wall St is general in nature. We provide commentary based on historical data and analyst forecasts only using an unbiased methodology and our articles are not intended to be financial advice. It does not constitute a recommendation to buy or sell any stock, and does not take account of your objectives, or your financial situation. We aim to bring you long-term focused analysis driven by fundamental data. Note that our analysis may not factor in the latest price-sensitive company announcements or qualitative material. Simply Wall St has no position in any stocks mentioned.
Have feedback on this article? Concerned about the content? Get in touch with us directly. Alternatively, email editorial-team@simplywallst.com