
- LIVE QUOTES
- LEARN
- HELP
 Nasdaq
 Wall Street Journal
EN
Provident Financial Holdings (PROV) Q2 EPS Steady As High Cost Ratio Tests Bull Narratives
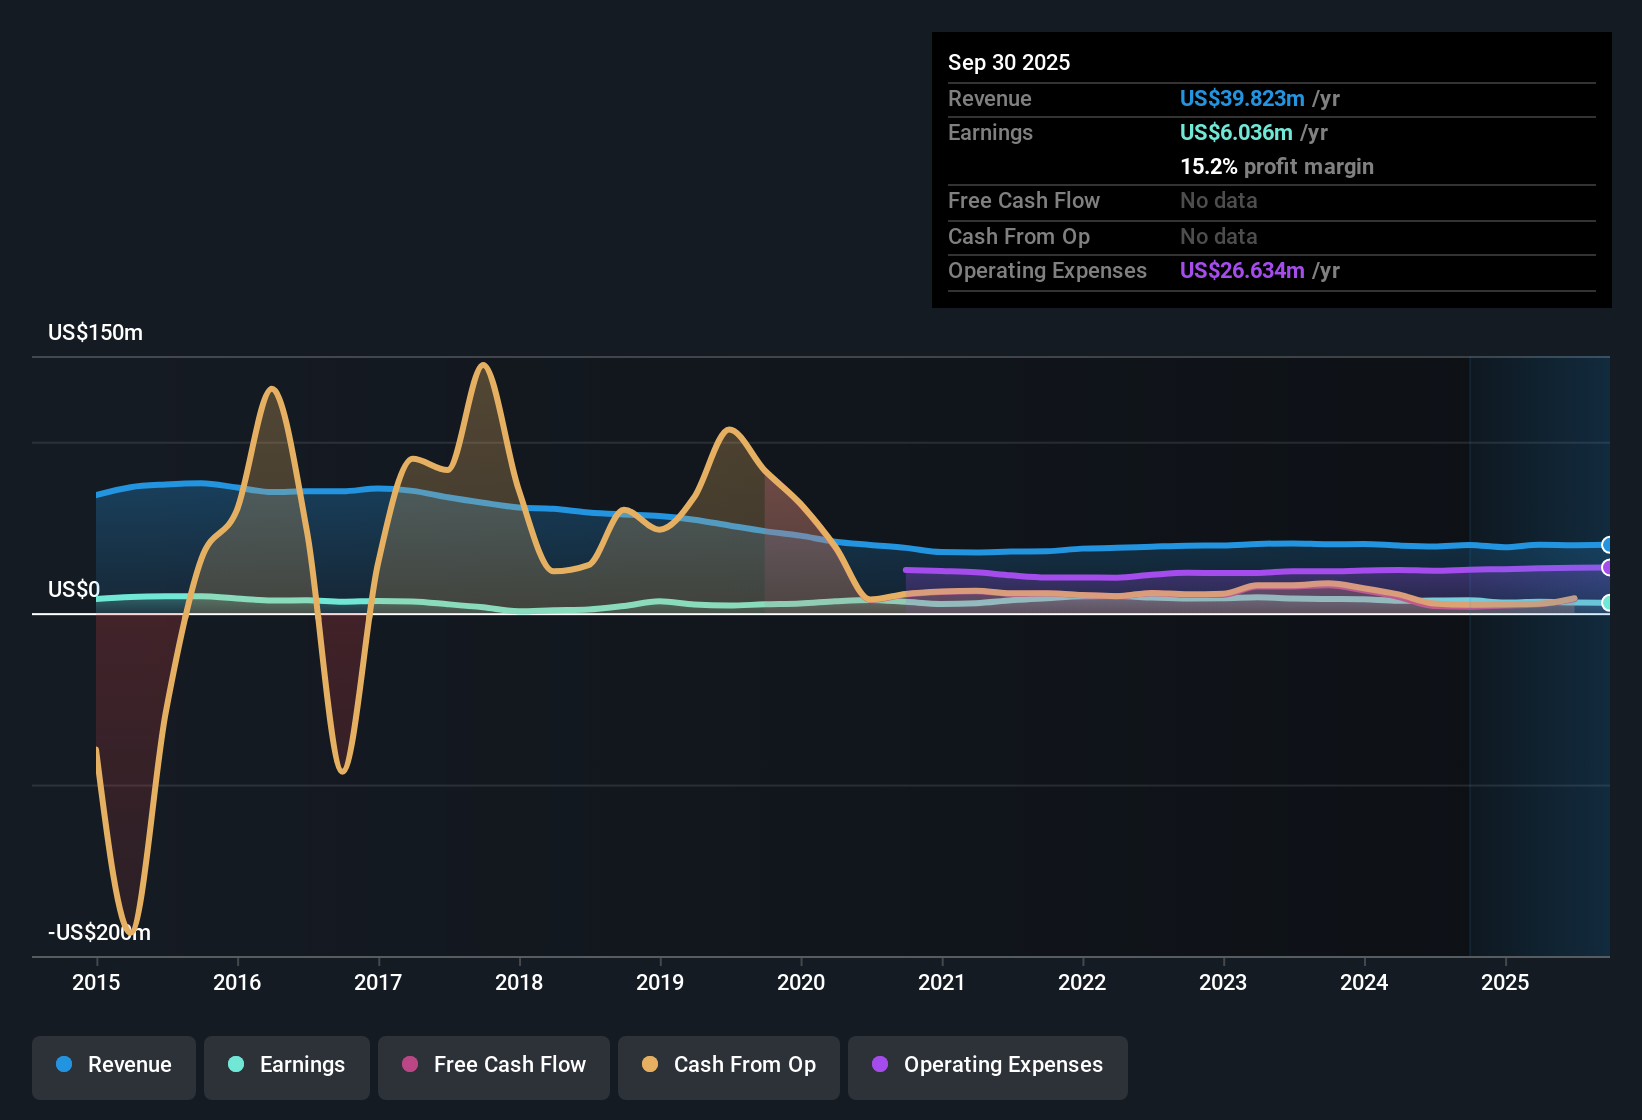
Provident Financial Holdings (PROV) has put up a quiet quarter on the top line, with Q2 2026 revenue at US$10.0 million and basic EPS of US$0.22, supported by trailing twelve month figures of US$40.8 million in revenue and EPS of about US$1.00. Over the last few quarters, revenue has moved within a tight band from US$9.0 million in Q2 2025 to US$10.7 million in Q3 2025, while quarterly EPS has ranged from US$0.13 to US$0.28. This leaves investors to focus on how the latest print fits into that steady but unspectacular earnings profile. With a 16.2% net profit margin and a 3.48% dividend yield in the background, this set of results keeps the story centered on how consistently the bank can defend its margins rather than chasing rapid growth.
See our full analysis for Provident Financial Holdings.With the latest numbers on the table, the next step is to line them up against the narratives that investors and analysts have been leaning on and see which stories still hold up and which start to look out of sync.
Curious how numbers become stories that shape markets? Explore Community Narratives
Cost Efficiency Still On The Heavy Side At Around 78%
- On a trailing basis, the cost to income ratio sits close to the high 70s, with recent quarterly readings at 78.35% in Q1 2026 and 77.64% in Q3 2025.
- What challenges a bullish angle on operating leverage is that these high 70s cost levels sit alongside relatively steady revenue near US$40.8 million over the last twelve months, suggesting limited recent evidence in the data of expenses easing as the bank holds its earnings line.
- Supporters might highlight the high quality of past earnings and a 16.2% net profit margin, but the cost base has not yet shown a clear shift in the figures provided.
- For anyone leaning bullish, the key tension is that EPS over the last twelve months sits at about US$1.00 while efficiency ratios remain elevated, so the current earnings power is being maintained with a fairly full expense load.
To see how these margin and efficiency trends fit into different long term views on the bank, have a look at how the full narrative lines up with the numbers. 📊 Read the full Provident Financial Holdings Consensus Narrative.
Asset Quality Steadies With Non Performing Loans Under US$2 Million
- Non performing loans were US$2.53 million in Q2 2025, then sat at US$2.106 million in Q1 2025, US$1.395 million in Q3 2025, US$1.414 million in Q4 2025, and US$1.888 million as of Q1 2026 on a trailing view.
- What leans toward a bullish reading is that this set of figures, all in the low single digit millions against a loan book a little above US$1.0 billion, sits alongside a 16.2% net profit margin and high quality trailing earnings, which together suggest that credit costs have not been dominating the income statement in the data you have.
- Bullish investors often look for this combination of steady asset quality and consistent net income, and here the bank recorded US$6.6 million of trailing twelve month net income alongside those non performing loan levels.
- Even though the five year profit trend shows a 4% annual earnings decline, the 6.1% earnings growth over the last year and contained non performing loan figures give bulls specific numbers to point to on earnings resilience.
If you want to see how optimistic investors connect these credit metrics to a long term story for the stock, you can run through the detailed bull case next. 🐂 Provident Financial Holdings Bull Case
P/E Of 15.8x Versus DCF Fair Value Of About US$7.81
- The shares trade on a P/E of 15.8x, lower than the US market multiple of 19.4x and peer average of 45x, while the current price of US$16.11 sits above a DCF fair value of about US$7.81.
- What bearish investors focus on here is the gap between the current share price and the DCF fair value, set against a five year earnings trend that declined 4% per year, even though the last year delivered 6.1% earnings growth and a 3.48% dividend yield.
- Bears point to the DCF fair value being materially below the market price as a sign that the current valuation may be rich relative to estimated future cash flows, despite the P/E sitting below broader market and peer levels.
- At the same time, the combination of a 16.2% net profit margin and a dividend yield of 3.48% gives bulls some income support to reference, so the valuation debate really turns on how much weight you put on the multi year earnings decline versus the recent 6.1% earnings growth.
If you are weighing whether these valuation tensions point to downside risk or a fair premium for stability, the detailed bear case walks through how cautious investors interpret these same numbers. 🐻 Provident Financial Holdings Bear Case
Next Steps
Don't just look at this quarter; the real story is in the long-term trend. We've done an in-depth analysis on Provident Financial Holdings's growth and its valuation to see if today's price is a bargain. Add the company to your watchlist or portfolio now so you don't miss the next big move.
See What Else Is Out There
Provident Financial Holdings keeps earnings steady but carries a high cost to income ratio in the high 70s and a share price above its DCF fair value.
If you are uneasy about paying up for a bank with full cost levels and a price above estimated cash flows, use these 874 undervalued stocks based on cash flows to quickly focus on companies where valuations and fundamentals line up more comfortably.
This article by Simply Wall St is general in nature. We provide commentary based on historical data and analyst forecasts only using an unbiased methodology and our articles are not intended to be financial advice. It does not constitute a recommendation to buy or sell any stock, and does not take account of your objectives, or your financial situation. We aim to bring you long-term focused analysis driven by fundamental data. Note that our analysis may not factor in the latest price-sensitive company announcements or qualitative material. Simply Wall St has no position in any stocks mentioned.
Have feedback on this article? Concerned about the content? Get in touch with us directly. Alternatively, email editorial-team@simplywallst.com