
- LIVE QUOTES
- LEARN
- HELP
 Nasdaq
 Wall Street Journal
EN
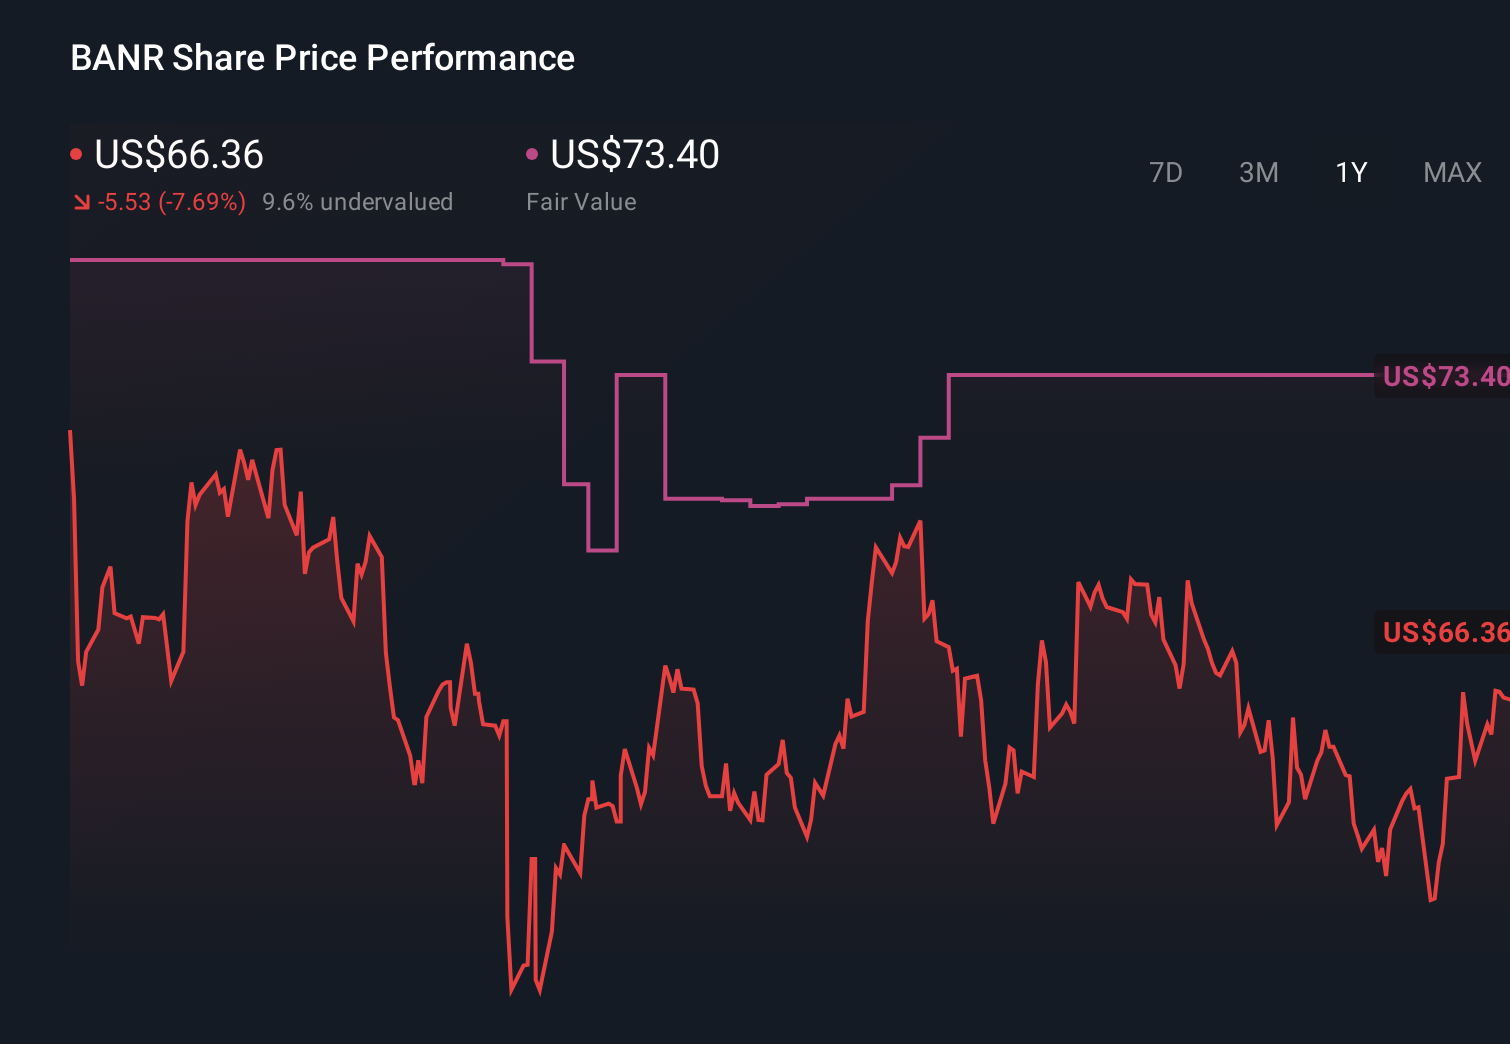
Banner (BANR) Is Down 5.3% After Mixed Q4 Beat And Revenue Miss Has The Bull Case Changed?
- Banner Corporation reported past fourth-quarter and full-year 2025 results, with net interest income, net income, and earnings per share all higher than a year earlier, alongside a regular US$0.50 per-share quarterly dividend declared for payment on February 13, 2026.
- Despite higher profitability, the quarter featured revenue below analyst expectations, muted loan growth, lower net charge-offs, and continued capital returns through share repurchases and dividends, giving a mixed picture of the bank’s operating momentum.
- We’ll now examine how Banner’s revenue shortfall despite an earnings beat shapes the company’s investment narrative and future risk-reward profile.
Trump has pledged to "unleash" American oil and gas and these 22 US stocks have developments that are poised to benefit.
What Is Banner's Investment Narrative?
For Banner, the investment case still hinges on a fairly valued, profitable regional bank that returns a meaningful amount of capital to shareholders, even if its growth outlook is more modest than the market’s. The latest quarter reinforced that story: net interest income and earnings moved higher, credit costs stayed low, and management backed that confidence with a US$0.50 dividend and continued buybacks, yet the revenue miss and 6% share price drop reminded investors that slower top-line progress and muted loan growth are front of mind. In the near term, the key catalysts remain margin resilience and any pickup in loan demand, while the biggest risks center on sluggish revenue growth and sensitivity to funding costs. The mixed quarter does not radically reset those drivers, but it puts execution under a brighter spotlight.
However, one risk around slower revenue growth is something investors should not overlook. Despite retreating, Banner's shares might still be trading 46% above their fair value. Discover the potential downside here.Exploring Other Perspectives
Explore 2 other fair value estimates on Banner - why the stock might be worth 23% less than the current price!
Build Your Own Banner Narrative
Disagree with this assessment? Create your own narrative in under 3 minutes - extraordinary investment returns rarely come from following the herd.
- A great starting point for your Banner research is our analysis highlighting 4 key rewards and 1 important warning sign that could impact your investment decision.
- Our free Banner research report provides a comprehensive fundamental analysis summarized in a single visual - the Snowflake - making it easy to evaluate Banner's overall financial health at a glance.
Searching For A Fresh Perspective?
Right now could be the best entry point. These picks are fresh from our daily scans. Don't delay:
- We've found 13 US stocks that are forecast to pay a dividend yield of over 6% next year. See the full list for free.
- The end of cancer? These 29 emerging AI stocks are developing tech that will allow early identification of life changing diseases like cancer and Alzheimer's.
- AI is about to change healthcare. These 109 stocks are working on everything from early diagnostics to drug discovery. The best part - they are all under $10b in market cap - there's still time to get in early.
This article by Simply Wall St is general in nature. We provide commentary based on historical data and analyst forecasts only using an unbiased methodology and our articles are not intended to be financial advice. It does not constitute a recommendation to buy or sell any stock, and does not take account of your objectives, or your financial situation. We aim to bring you long-term focused analysis driven by fundamental data. Note that our analysis may not factor in the latest price-sensitive company announcements or qualitative material. Simply Wall St has no position in any stocks mentioned.
Have feedback on this article? Concerned about the content? Get in touch with us directly. Alternatively, email editorial-team@simplywallst.com