
- LIVE QUOTES
- LEARN
- HELP
 Nasdaq
 Wall Street Journal
EN
Is It Time To Reassess Acuity Brands (AYI) After The Recent Share Price Pullback
- If you are wondering whether Acuity is starting to look like value at its current share price, you are not alone. This article will focus on what the numbers are actually saying.
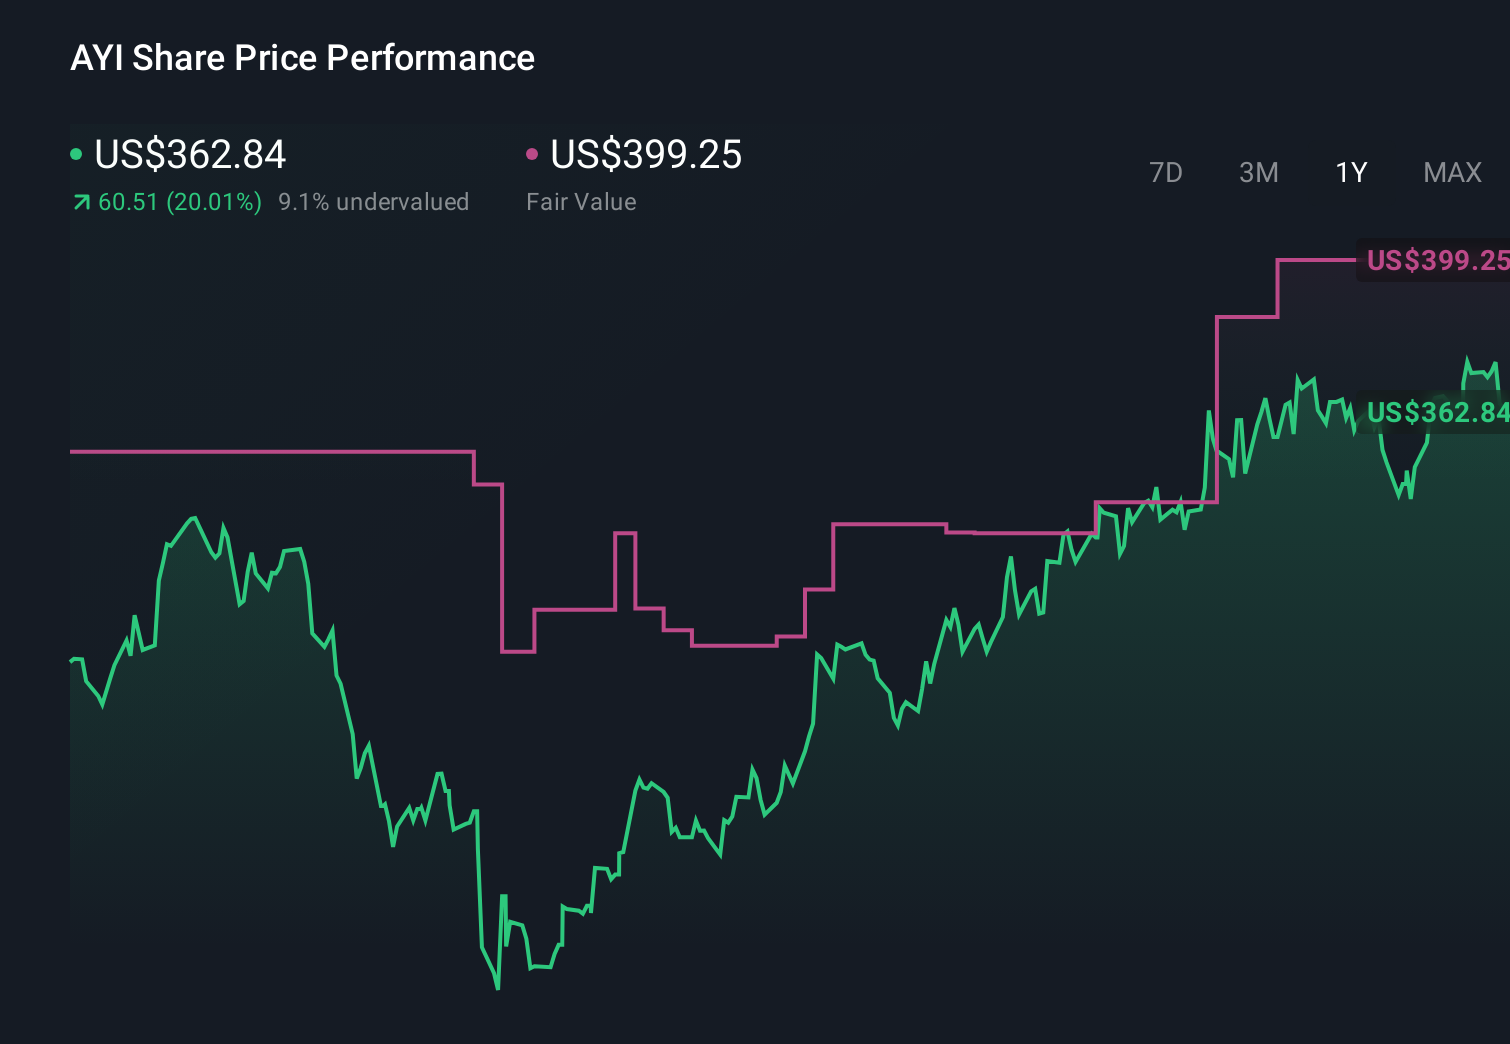
- The stock last closed at US$315.25, with returns of a 1.6% decline over 7 days, a 15.3% decline over 30 days, a 15.6% decline year to date, a 5.7% decline over 1 year, 71.6% over 3 years and 165.5% over 5 years. This gives a mixed picture for investors thinking about their next move.
- Recent price moves have arrived alongside ongoing coverage of the US capital goods sector and investor interest in companies listed on the NYSE. This keeps Acuity on the radar of many long term holders and helps frame the question of whether current expectations are in line with what Acuity might reasonably be worth.
- Acuity currently has a valuation score of 5 out of 6 on Simply Wall St. Next we will look at how different valuation approaches arrive at that verdict before finishing with a broader way to think about the company’s value in your portfolio.
Find out why Acuity's -5.7% return over the last year is lagging behind its peers.
Approach 1: Acuity Discounted Cash Flow (DCF) Analysis
A Discounted Cash Flow, or DCF, model takes the cash that a business is expected to generate in the future, then discounts those amounts back to today to estimate what the entire company might be worth right now.
For Acuity, the model uses a 2 Stage Free Cash Flow to Equity approach. The latest twelve month free cash flow is about $533.6 million. Analysts provide free cash flow estimates for the next few years, and Simply Wall St then extends those projections out to 10 years, with forecast free cash flow reaching about $980.3 million in 2035. Each of those projected cash flows is discounted back to today using the DCF framework.
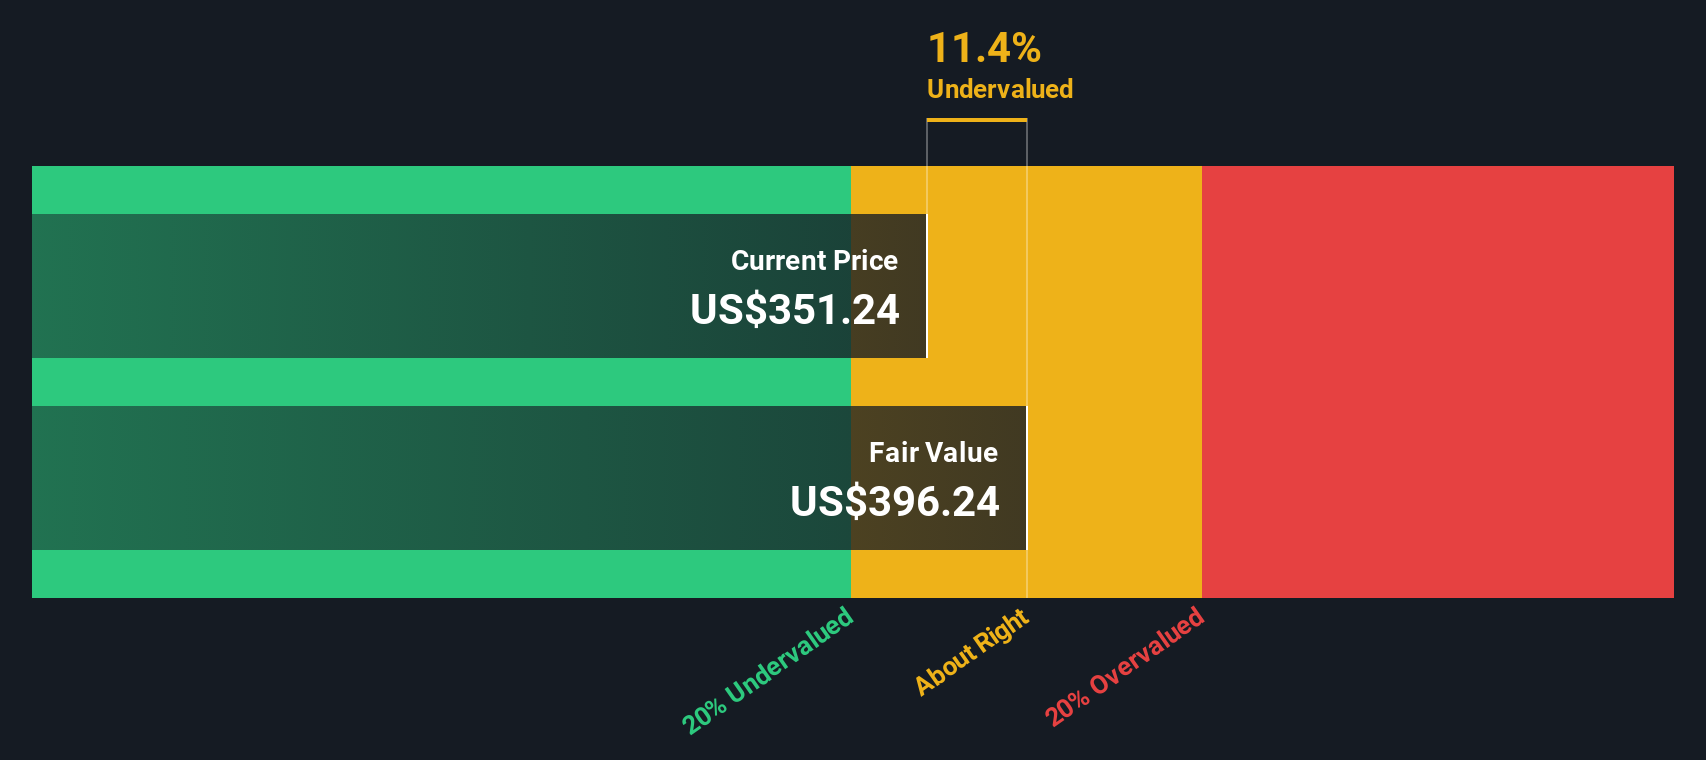
On this basis, the estimated intrinsic value comes out to around $374.07 per share, compared with the recent share price of about $315.25. That gap implies Acuity is trading at roughly a 15.7% discount to this DCF estimate of value.
Result: UNDERVALUED
Our Discounted Cash Flow (DCF) analysis suggests Acuity is undervalued by 15.7%. Track this in your watchlist or portfolio, or discover 864 more undervalued stocks based on cash flows.
Approach 2: Acuity Price vs Earnings
For a profitable company like Acuity, the P/E ratio is a useful way to relate what you pay for the stock to the earnings it currently produces. Investors usually expect higher growth or lower risk to justify a higher P/E, while slower growth or higher risk often goes with a lower, more cautious P/E.
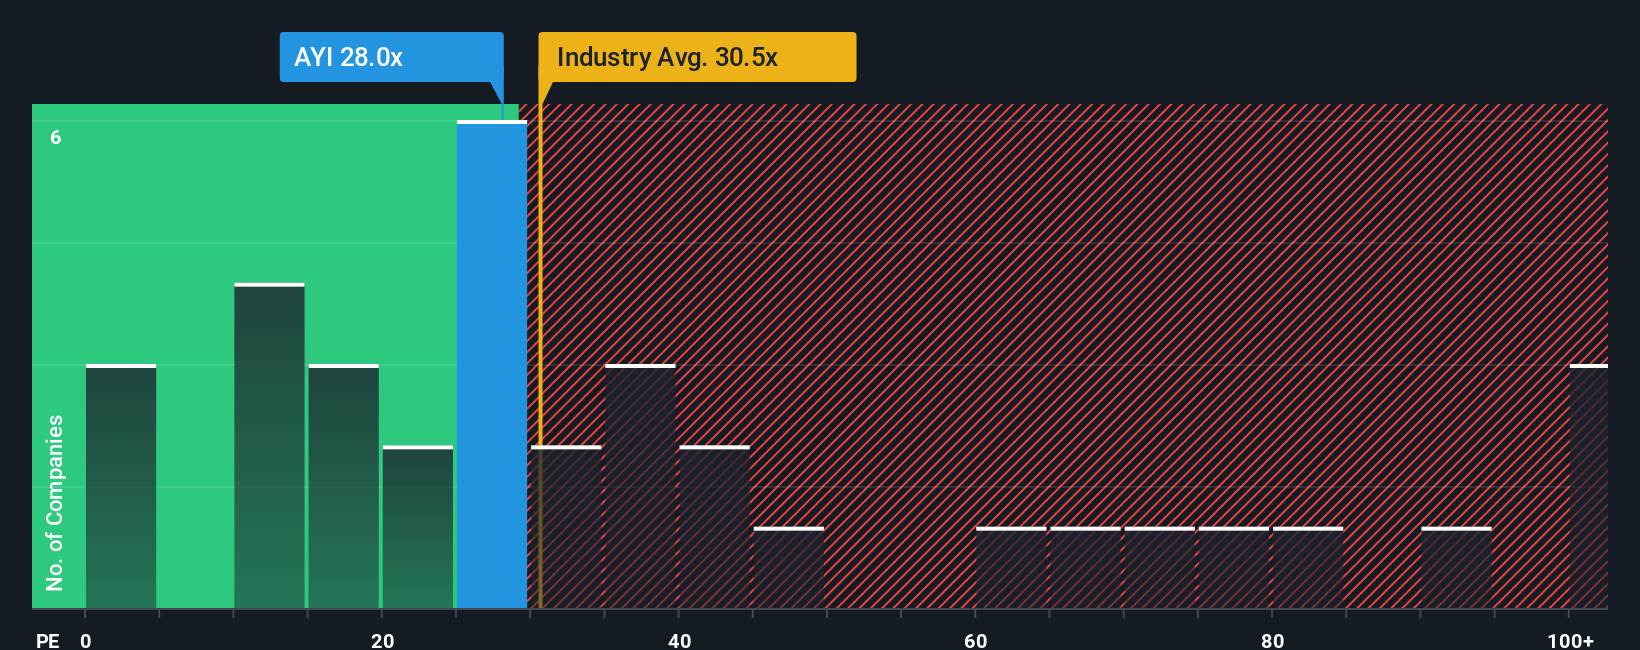
Acuity is trading on a P/E of about 23.4x. That sits below both the Electrical industry average of around 32.5x and a broader peer group average of about 43.7x. On the surface, that suggests the market is putting a lower earnings multiple on Acuity than on many comparable companies.
Simply Wall St also calculates a Fair Ratio for Acuity of roughly 24.5x. This is a proprietary P/E estimate that aims to reflect the company’s own earnings growth profile, profit margins, industry, market cap and risk characteristics. Because it is tailored to Acuity rather than just copied from peers or the sector, it can be a more targeted benchmark than a simple industry or peer comparison.
Comparing the Fair Ratio of 24.5x with the current P/E of 23.4x suggests the share price is somewhat below this earnings based reference point.
Result: UNDERVALUED
P/E ratios tell one story, but what if the real opportunity lies elsewhere? Discover 1428 companies where insiders are betting big on explosive growth.
Upgrade Your Decision Making: Choose your Acuity Narrative
Earlier we mentioned that there is an even better way to understand valuation, so let us introduce you to Narratives, a simple way to connect your view of Acuity’s business to a set of numbers and a fair value that you can actually compare with today’s share price.
A Narrative is your story for the company, where you spell out what you think might happen to revenue, earnings and profit margins in the years ahead, and then translate that story into a financial forecast and an estimated fair value per share.
On Simply Wall St, within the Community page used by millions of investors, Narratives are set up so you can quickly adjust assumptions, see how that flows through to future cash flows or earnings, and then compare your Fair Value with the current market Price to help decide whether Acuity looks attractive or stretched to you.
Narratives also update automatically when fresh information such as news or earnings releases is added to the platform. This means your fair value view of Acuity can stay aligned with the latest data without you rebuilding your model from scratch.
For example, one Acuity Narrative might assume conservative revenue growth and a lower profit margin, while another assumes stronger growth and steadier margins. This leads to very different fair value estimates even though both are built from the same underlying data.
Do you think there's more to the story for Acuity? Head over to our Community to see what others are saying!
This article by Simply Wall St is general in nature. We provide commentary based on historical data and analyst forecasts only using an unbiased methodology and our articles are not intended to be financial advice. It does not constitute a recommendation to buy or sell any stock, and does not take account of your objectives, or your financial situation. We aim to bring you long-term focused analysis driven by fundamental data. Note that our analysis may not factor in the latest price-sensitive company announcements or qualitative material. Simply Wall St has no position in any stocks mentioned.
Have feedback on this article? Concerned about the content? Get in touch with us directly. Alternatively, email editorial-team@simplywallst.com