
- LIVE QUOTES
- LEARN
- HELP
 Nasdaq
 Wall Street Journal
EN
Wealthfront (WLTH) Valuation Update As Mixed Q3 Earnings Shift Focus To Long Term Upside Potential
Wealthfront earnings spark fresh look at the stock
Wealthfront (WLTH) just released third quarter and nine month results to October 31, 2025, highlighting higher revenue alongside weaker earnings metrics over the longer period, a mix that gives investors more to unpack.
See our latest analysis for Wealthfront.
The mixed earnings story appears to line up with the share price pattern this year. The 1 day share price return of 3.14% contrasts with a 30 day share price return of 30.25% and a year to date share price return of 30.41%, which suggests recent momentum has weakened after earlier strength.
If this earnings move has you reassessing your watchlist, it could be a useful moment to broaden your search with fast growing stocks with high insider ownership.
With WLTH down about 30% over the past month but trading well below the average analyst price target, investors may question whether the recent weakness is leaving the stock undervalued or whether the market is already factoring in expectations for future growth.
Most Popular Narrative: 43.1% Undervalued
Wealthfront's most followed narrative points to a fair value of $16.17 versus a last close of $9.20, a sizable gap that puts the long term story in focus.
The client base is concentrated in digital natives with an average age of 38 years, and this group holds US$16t of household net worth that is projected in the call to grow at 11% annually over two decades, which can support higher platform assets and advisory revenue over time.
Want to see what kind of revenue path, margin profile and future earnings multiple need to line up for that valuation gap to make sense? The narrative breaks down how growth, profitability and the chosen discount rate all work together, and which assumptions have to hold for that fair value to stack up.
Result: Fair Value of $16.17 (UNDERVALUED)
Have a read of the narrative in full and understand what's behind the forecasts.
However, that upside story could be challenged if referral driven client growth slows or newer products like Home Lending and direct indexing struggle to gain traction.
Find out about the key risks to this Wealthfront narrative.
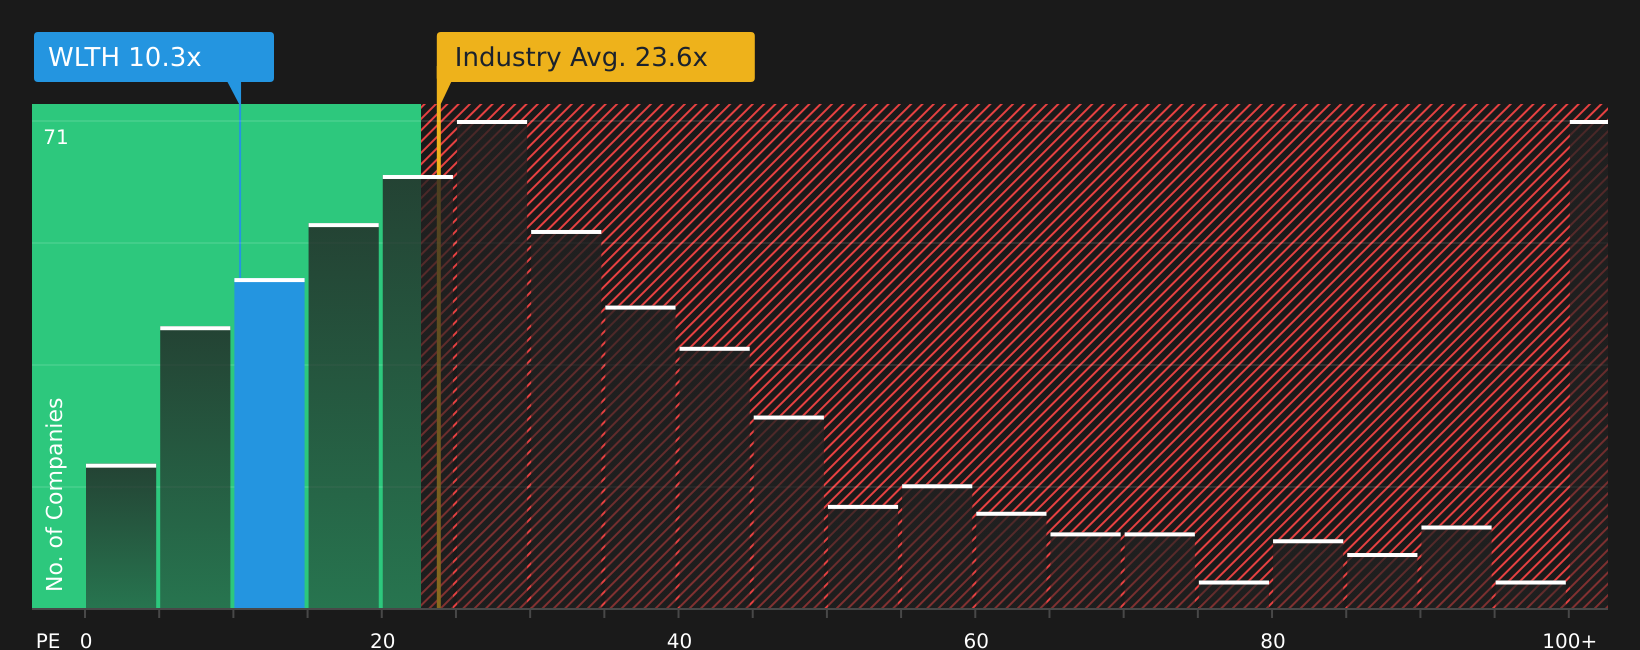
Another View: Market Multiple Sends A Different Signal
The narrative points to a $16.17 fair value and an undervalued story, but the current P/E of 10.9x is higher than the peer average of 9.7x, even though it is below the broader US Capital Markets average of 25.8x. That mix hints at some valuation risk rather than a straight bargain, so which signal do you trust more?
See what the numbers say about this price — find out in our valuation breakdown.
Build Your Own Wealthfront Narrative
If this version of the story does not quite fit how you see the data, you can pull in your own assumptions, test different scenarios and build a custom view in just a few minutes with Do it your way.
A great starting point for your Wealthfront research is our analysis highlighting 4 key rewards and 3 important warning signs that could impact your investment decision.
Looking for more investment ideas?
Before you move on, give yourself a better shot at finding strong opportunities by scanning a few focused stock lists that surface clear, data backed themes.
- Target dependable income by checking out these 12 dividend stocks with yields > 3% that highlight companies offering yields above 3%.
- Ride long term technology shifts by reviewing these 24 AI penny stocks featuring businesses tied to artificial intelligence trends.
- Position early in potential value ideas by scanning these 873 undervalued stocks based on cash flows identified through discounted cash flow analysis.
This article by Simply Wall St is general in nature. We provide commentary based on historical data and analyst forecasts only using an unbiased methodology and our articles are not intended to be financial advice. It does not constitute a recommendation to buy or sell any stock, and does not take account of your objectives, or your financial situation. We aim to bring you long-term focused analysis driven by fundamental data. Note that our analysis may not factor in the latest price-sensitive company announcements or qualitative material. Simply Wall St has no position in any stocks mentioned.
Have feedback on this article? Concerned about the content? Get in touch with us directly. Alternatively, email editorial-team@simplywallst.com