
- LIVE QUOTES
- LEARN
- HELP
 Nasdaq
 Wall Street Journal
EN
Is It Too Late To Consider St. Joe (JOE) After A 36.8% One Year Gain
- If you are wondering whether St. Joe at around US$64.79 is offering fair value or if the current price is getting ahead of itself, this article will walk you through what the numbers are indicating.
- The stock has returned 9.2% over the last 30 days and 36.8% over the past year, with a 1.1% decline over the last week and a year to date return of 8.3%. This naturally raises questions about how much of the story is already reflected in the price.
- Over the past year, St. Joe has continued to attract attention as a real estate name tied to Florida's long term development theme, which has kept it on the radar for many long term holders. At the same time, some investors are watching how sentiment around property and interest rates feeds into expectations for companies like St. Joe, helping to frame these recent returns.
- Our valuation checks give St. Joe a 2 out of 6 score. Next, we will look at what different valuation approaches suggest about that number and why there may be an even better way to think about value by the end of this article.
St. Joe scores just 2/6 on our valuation checks. See what other red flags we found in the full valuation breakdown.
Approach 1: St. Joe Discounted Cash Flow (DCF) Analysis
A Discounted Cash Flow, or DCF, model estimates what a company might be worth by projecting its future cash flows and then discounting those cash flows back to today. It is essentially asking what those future dollars are worth in present terms.
For St. Joe, the model uses a 2 Stage Free Cash Flow to Equity approach and starts with last twelve months free cash flow of about $167.7 million. Simply Wall St then extends analyst style estimates, with projected free cash flow reaching about $379.5 million in 2035, using gradually moderating growth assumptions. All figures are in US$.
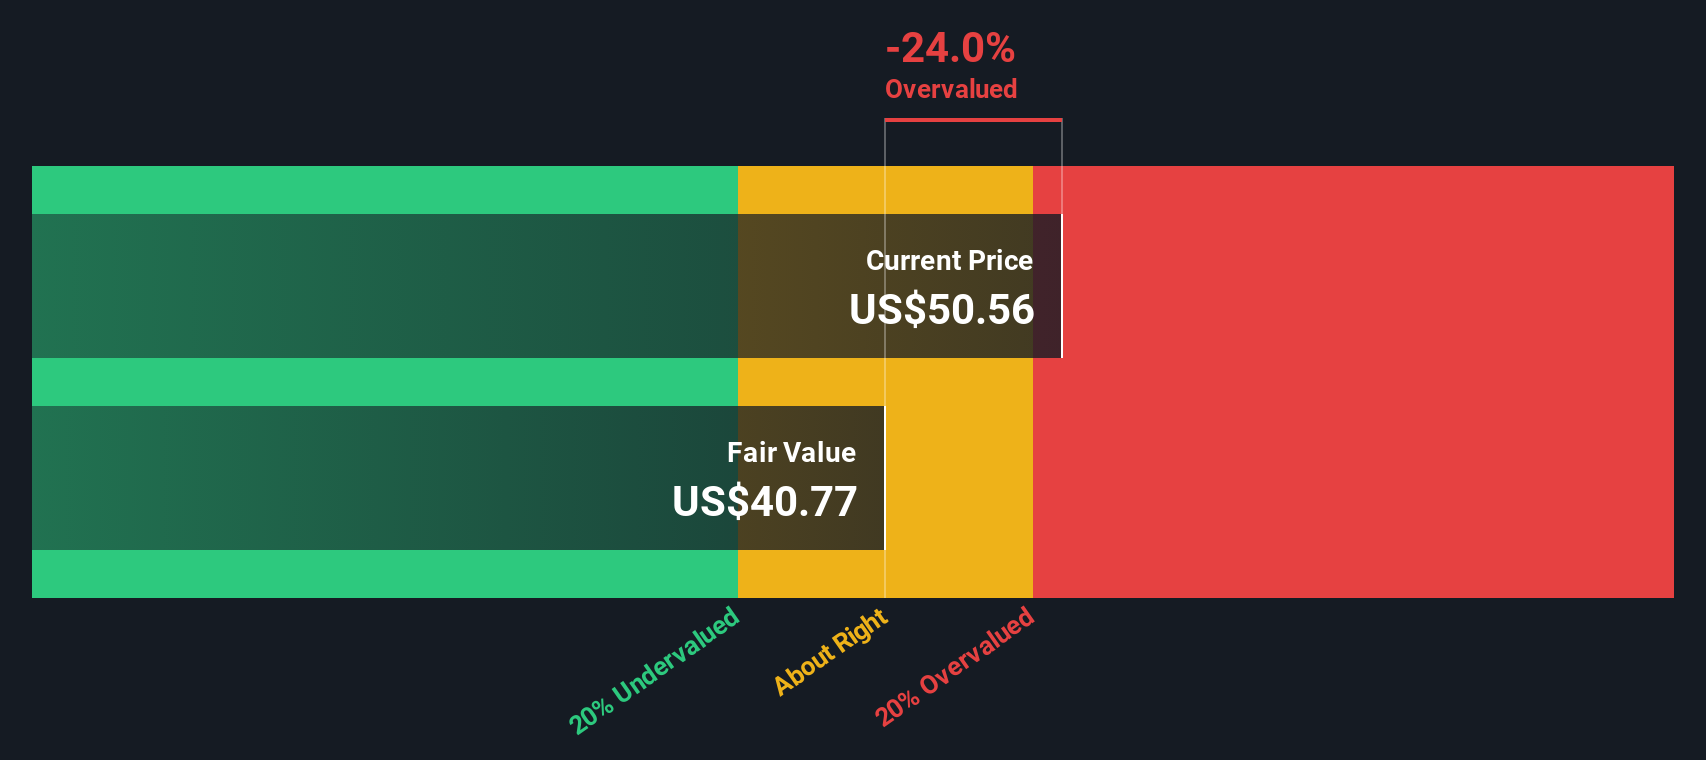
When those projected cash flows are discounted back and combined with a terminal value, the model arrives at an intrinsic value estimate of about $80.03 per share. Compared with the recent share price around $64.79, the DCF output implies St. Joe trades at roughly a 19.0% discount to this estimate, using this valuation framework.
Result: UNDERVALUED
Our Discounted Cash Flow (DCF) analysis suggests St. Joe is undervalued by 19.0%. Track this in your watchlist or portfolio, or discover 876 more undervalued stocks based on cash flows.
Approach 2: St. Joe Price vs Earnings
For profitable companies, the P/E ratio is a straightforward way to think about what you are paying for each dollar of current earnings. It links the share price directly to the bottom line, which makes it a familiar anchor for many investors.
A “normal” or “fair” P/E usually reflects what the market expects for future earnings growth and how risky those earnings appear. Higher expected growth or perceived stability can support a higher P/E, while slower growth or higher uncertainty often goes with a lower P/E.
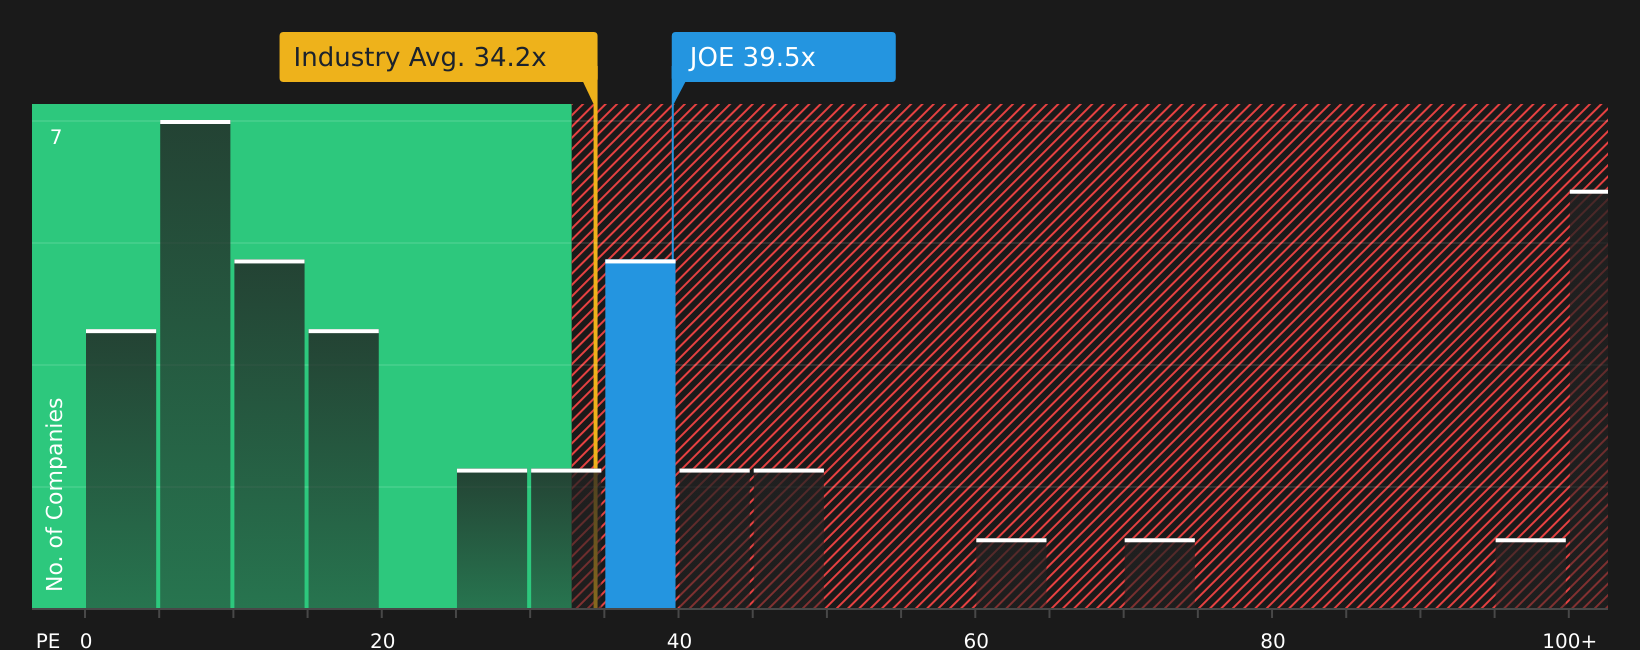
St. Joe currently trades on a P/E of 35.76x, compared with the Real Estate industry average of about 30.64x and a peer group average of 44.52x. Simply Wall St also uses a proprietary “Fair Ratio” which estimates the P/E you might expect for St. Joe after considering factors like its earnings growth profile, profit margins, industry, market cap and key risks. This Fair Ratio aims to be more tailored than a simple peer or industry comparison because it accounts for company specific fundamentals rather than only who it sits next to in a sector table.
As the Fair Ratio is not available for St. Joe here, this P/E view is best treated as a cross check alongside the DCF output rather than a firm valuation call.
Result: ABOUT RIGHT
P/E ratios tell one story, but what if the real opportunity lies elsewhere? Discover 1431 companies where insiders are betting big on explosive growth.
Upgrade Your Decision Making: Choose your St. Joe Narrative
Earlier we mentioned that there is an even better way to think about valuation, so let us introduce you to Narratives, which are simply your story about a company tied directly to your own fair value, revenue, earnings and margin assumptions. A Narrative connects three things: what you think is happening at the business, how that might show up in a financial forecast, and what that implies for fair value. It then compares that fair value to today’s price to help you decide whether you see St. Joe as attractive, fully priced or expensive. On Simply Wall St, millions of investors share these Narratives on the Community page, and each one updates automatically when new information such as earnings or news is added, so your view stays in sync with the latest data without extra work from you. For example, one St. Joe Narrative might assume a relatively cautious outlook and arrive at a much lower fair value, while another might lean into a more optimistic long term development story and reach a higher fair value, and you can see both side by side against the current share price.
Do you think there's more to the story for St. Joe? Head over to our Community to see what others are saying!

This article by Simply Wall St is general in nature. We provide commentary based on historical data and analyst forecasts only using an unbiased methodology and our articles are not intended to be financial advice. It does not constitute a recommendation to buy or sell any stock, and does not take account of your objectives, or your financial situation. We aim to bring you long-term focused analysis driven by fundamental data. Note that our analysis may not factor in the latest price-sensitive company announcements or qualitative material. Simply Wall St has no position in any stocks mentioned.
Have feedback on this article? Concerned about the content? Get in touch with us directly. Alternatively, email editorial-team@simplywallst.com