
- LIVE QUOTES
- LEARN
- HELP
 Nasdaq
 Wall Street Journal
EN
Has Ormat Technologies (ORA) Shares Run Too Far After Strong 1‑Year Rally?
- If you are wondering whether Ormat Technologies at around US$122 is priced attractively or asking too much, you are not alone.
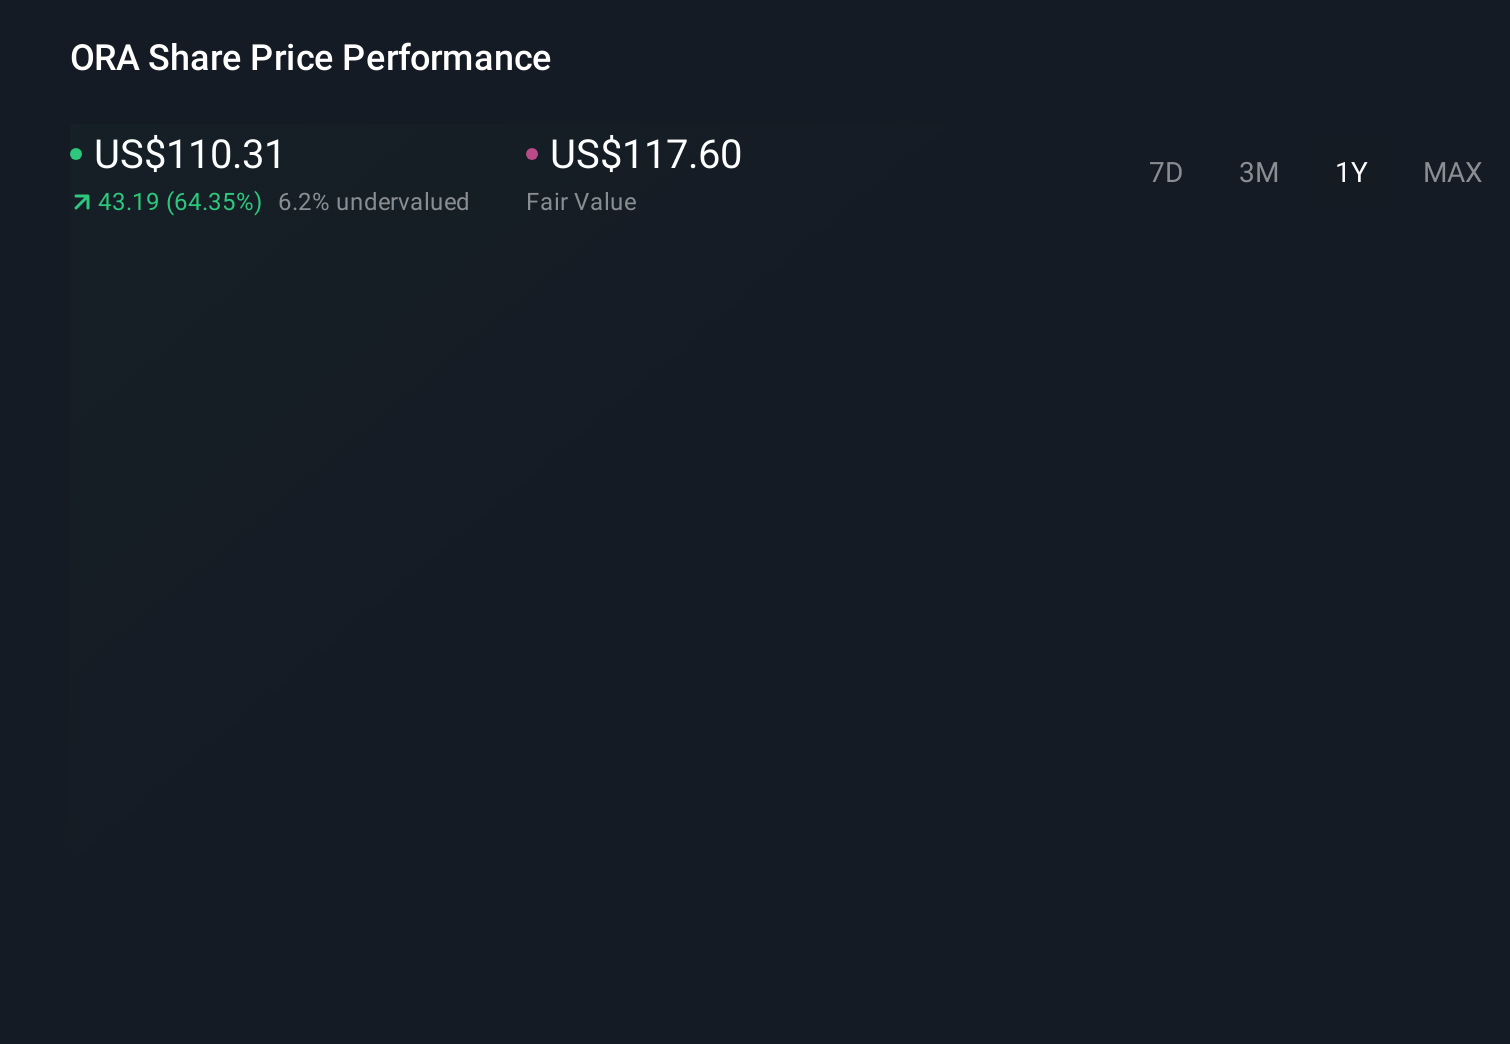
- The stock shows returns of 1.9% over 7 days, 8.8% over 30 days, 7.3% year to date, 90.4% over 1 year, 35.1% over 3 years and 10.4% over 5 years. This naturally raises questions about how this performance lines up with the current share price.
- Recent news coverage has focused on Ormat Technologies as a US listed utilities business with exposure to renewable energy themes and its position within that sector. This context helps frame why the share price performance might be drawing more attention from investors looking at long term trends.
- Simply Wall St currently assigns Ormat Technologies a valuation score of 0/6. In the next sections we will walk through the different valuation approaches behind that figure, before finishing with a perspective that can help you make even better sense of what the valuation really means.
Ormat Technologies scores just 0/6 on our valuation checks. See what other red flags we found in the full valuation breakdown.
Approach 1: Ormat Technologies Discounted Cash Flow (DCF) Analysis
A Discounted Cash Flow, or DCF, model estimates what a company might be worth today by projecting its future cash flows and then discounting those back to a present value.
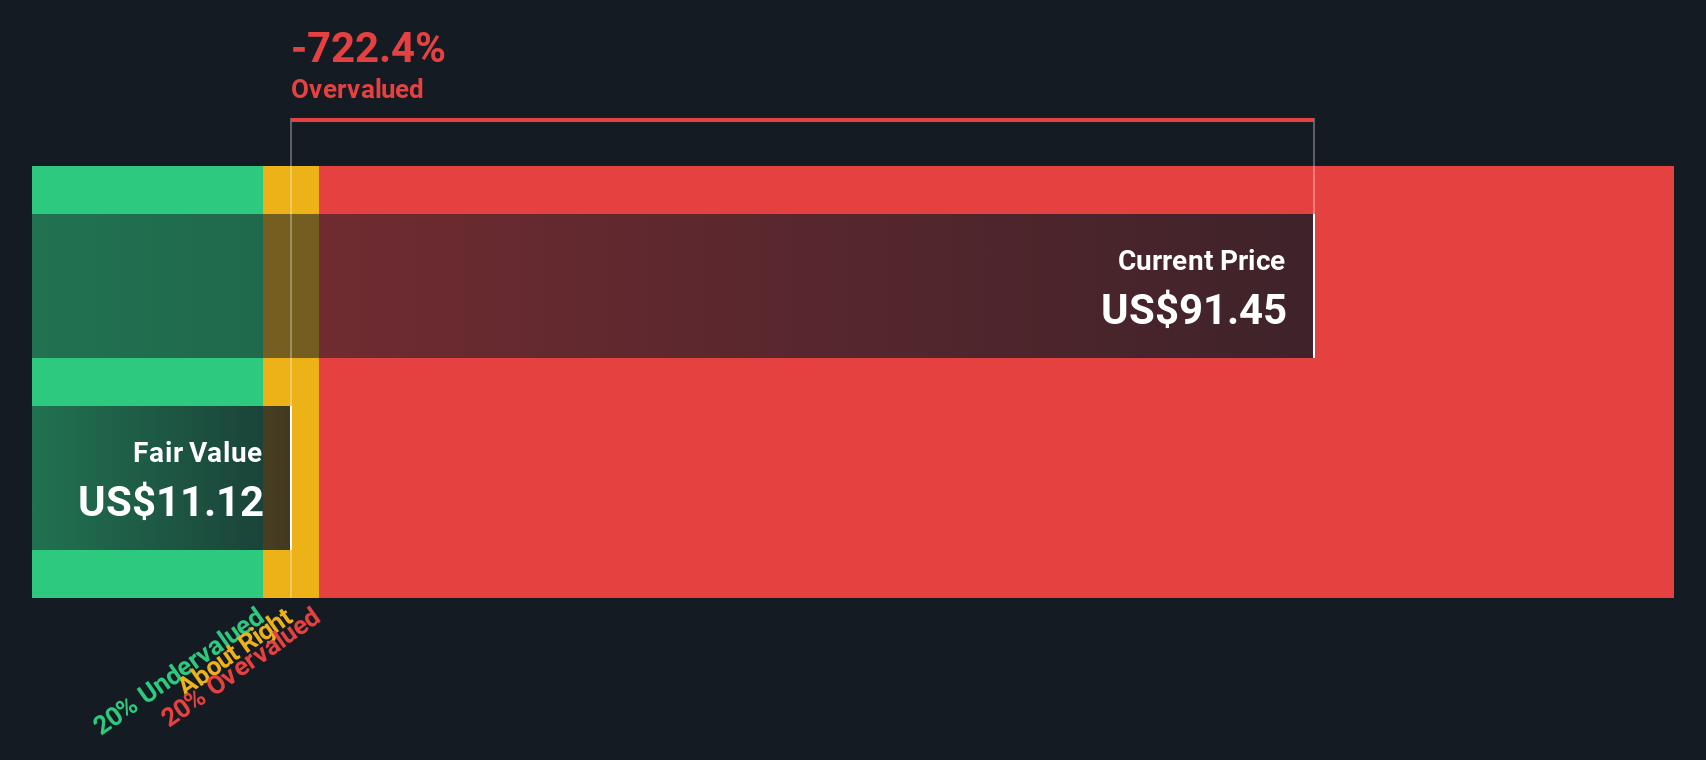
For Ormat Technologies, the model used is a 2 Stage Free Cash Flow to Equity approach. The latest twelve month free cash flow is a loss of about $235 million, so the starting point is negative. Analysts provide estimates out to 2027, with free cash flow projected at $9.7 million in that year, and the remaining years in the 10 year path are extrapolated rather than direct analyst forecasts.
Those projected cash flows, such as an estimated $118.1 million by 2035, are discounted back using Simply Wall St’s assumptions. This leads to an estimated intrinsic value of about $24.92 per share. Compared with the current share price of around $122, the DCF output suggests the stock is very expensive, with an implied premium of roughly 389.5%.
This model points to Ormat Technologies trading at a heavy premium to its cash flow based estimate.
Result: OVERVALUED
Our Discounted Cash Flow (DCF) analysis suggests Ormat Technologies may be overvalued by 389.5%. Discover 876 undervalued stocks or create your own screener to find better value opportunities.
Approach 2: Ormat Technologies Price vs Earnings
For profitable companies, the P/E ratio is a useful yardstick because it connects what you pay for each share with the earnings that business generates. In simple terms, it helps you see how many dollars investors are currently willing to pay for each dollar of earnings.
What counts as a “normal” P/E typically reflects how the market views growth potential and risk. Higher expected growth or lower perceived risk can justify a higher multiple, while lower expected growth or higher risk usually pull the multiple down.
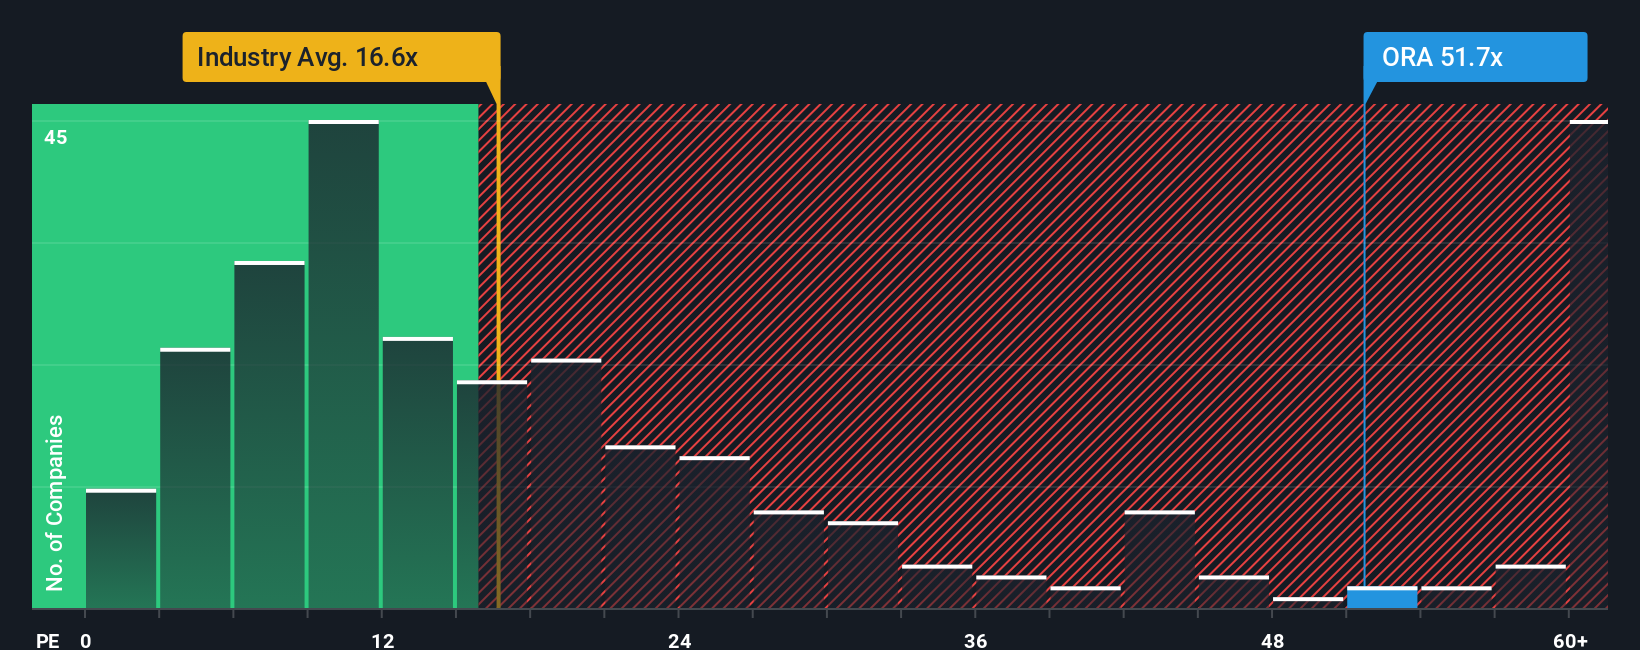
Ormat Technologies is trading on a P/E of 55.60x. That sits well above the Renewable Energy industry average of 17.13x and a peer average of 16.97x. To move beyond those broad comparisons, Simply Wall St uses a “Fair Ratio” metric, which estimates what a more tailored P/E might look like.
The Fair Ratio for Ormat is 20.60x. This figure incorporates factors such as earnings growth, profit margins, industry, market cap and risk, so it can be more informative than a simple industry or peer check.
Comparing the Fair Ratio of 20.60x with the current P/E of 55.60x suggests the shares are trading at a premium to this tailored benchmark.
Result: OVERVALUED
P/E ratios tell one story, but what if the real opportunity lies elsewhere? Discover 1444 companies where insiders are betting big on explosive growth.
Upgrade Your Decision Making: Choose your Ormat Technologies Narrative
Earlier we mentioned that there is an even better way to understand valuation, so let us introduce you to Narratives, a simple way to connect your view of Ormat Technologies with the numbers behind it.
A Narrative is your story about a company, written in financial terms, where you set assumptions for fair value, future revenue, earnings and margins so the numbers clearly match the way you see the business.
On Simply Wall St’s Community page, used by millions of investors, Narratives link Ormat Technologies’ story to a financial forecast and then to a fair value that you can compare directly with the current share price. This can help you decide whether you see it as an opportunity or something to avoid.
Because Narratives update automatically when new information such as results or news is added to the platform, your fair value view stays aligned with what is happening. You can see, for example, one investor setting a much higher fair value for Ormat Technologies than another who uses more cautious revenue and margin assumptions.
Do you think there's more to the story for Ormat Technologies? Head over to our Community to see what others are saying!
This article by Simply Wall St is general in nature. We provide commentary based on historical data and analyst forecasts only using an unbiased methodology and our articles are not intended to be financial advice. It does not constitute a recommendation to buy or sell any stock, and does not take account of your objectives, or your financial situation. We aim to bring you long-term focused analysis driven by fundamental data. Note that our analysis may not factor in the latest price-sensitive company announcements or qualitative material. Simply Wall St has no position in any stocks mentioned.
Have feedback on this article? Concerned about the content? Get in touch with us directly. Alternatively, email editorial-team@simplywallst.com