
- LIVE QUOTES
- LEARN
- HELP
 Nasdaq
 Wall Street Journal
EN
Is SolarEdge Technologies (SEDG) Pricing Reflect Its Sharp Rebound After Last Year’s Slump
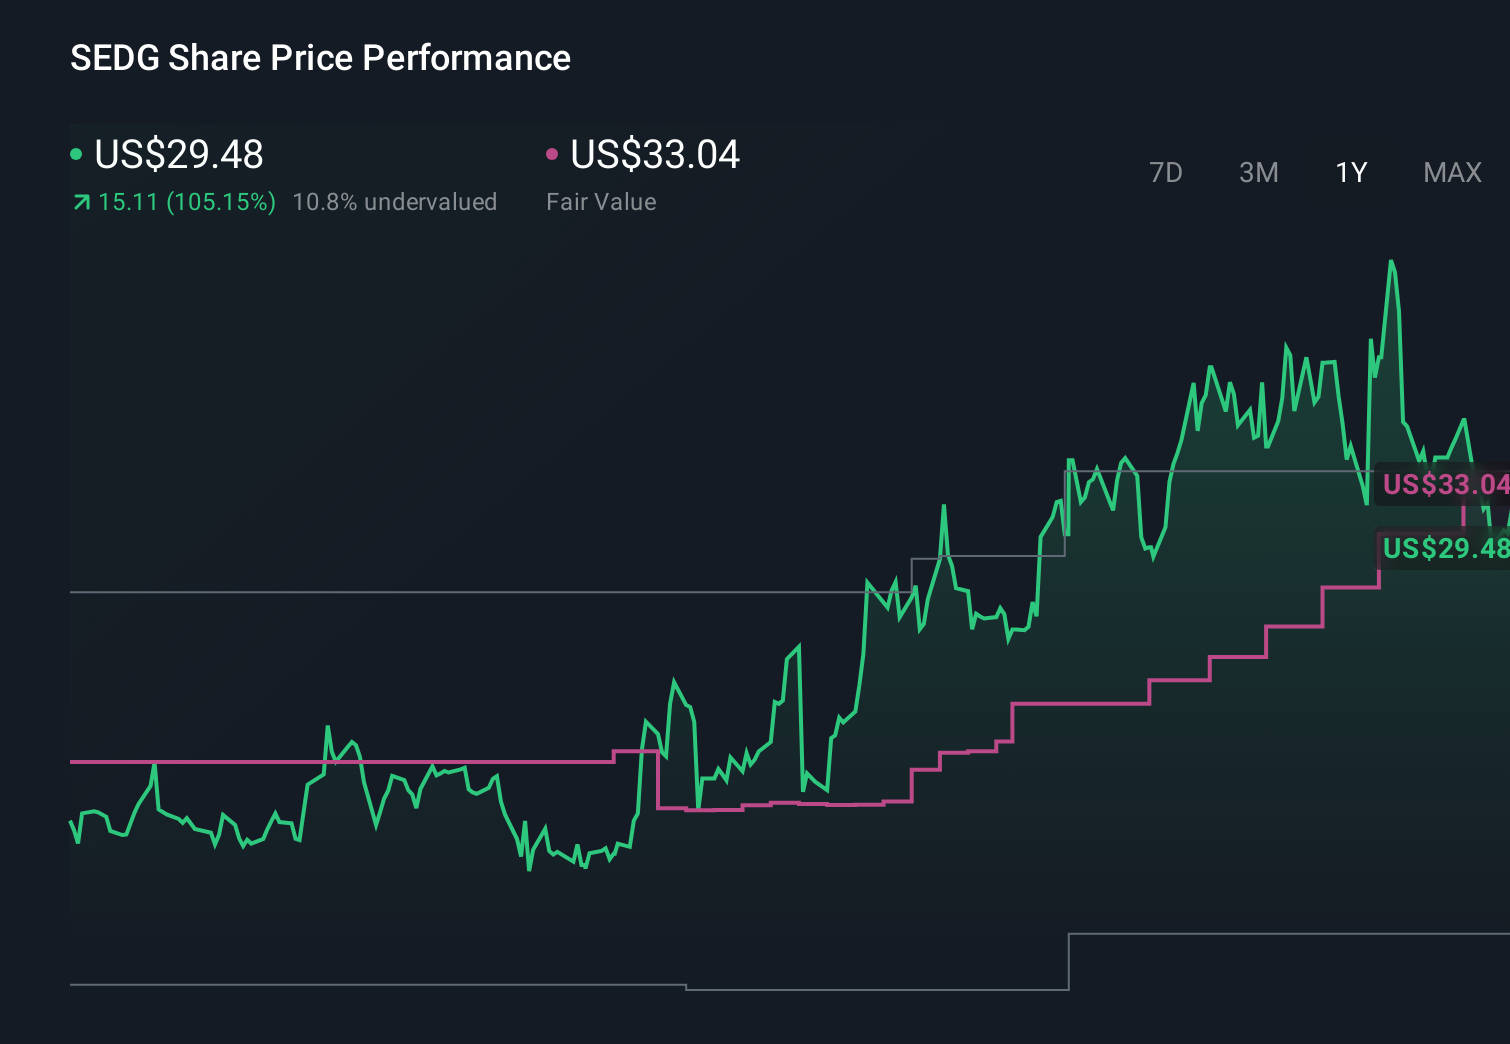
- If you are trying to figure out whether SolarEdge Technologies at around US$33.34 is a bargain or a value trap, you are in the right place.
- The stock has had a mixed ride, with a 4.1% decline over the last 7 days, a 7.9% gain over 30 days, a 6.3% return year to date, a 155.5% return over 1 year, and very large declines of 88.9% over 3 years and 88.3% over 5 years.
- Recent market attention has focused on SolarEdge Technologies as investors reassess the solar equipment sector and its longer term prospects. This has contributed to the sharp share price swings you see in the short and multi year returns. Broader sentiment around solar demand, financing conditions and policy support has been a key backdrop for these moves, as investors weigh up risk against potential recovery.
- SolarEdge Technologies currently scores 2 out of 6 on our valuation checks. Next we will look at what that means using several common valuation approaches, before finishing with a way to think about value that can be even more useful than any single model.
SolarEdge Technologies scores just 2/6 on our valuation checks. See what other red flags we found in the full valuation breakdown.
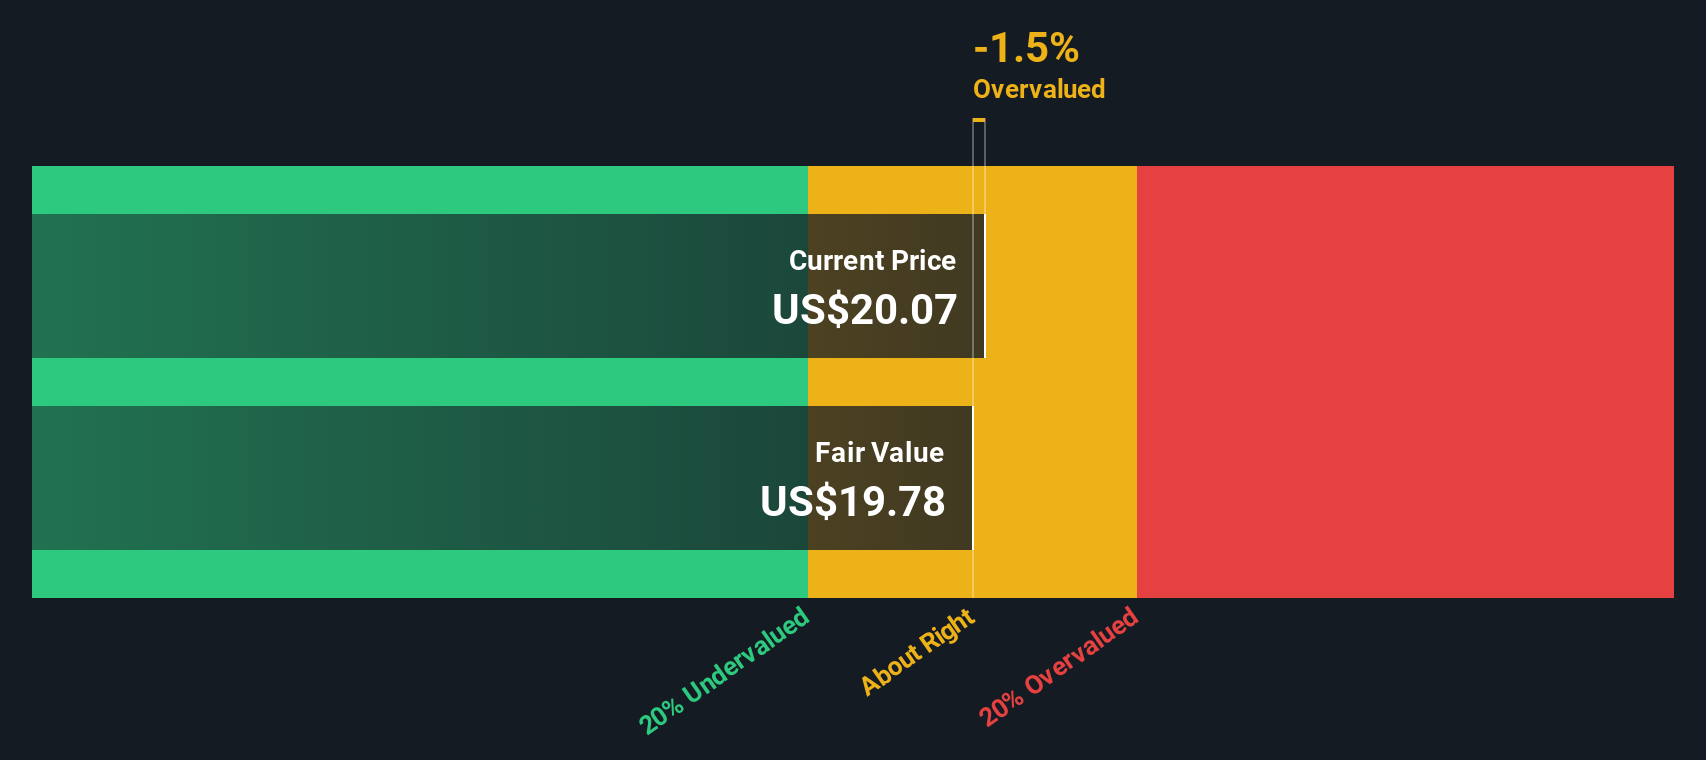
Approach 1: SolarEdge Technologies Discounted Cash Flow (DCF) Analysis
A Discounted Cash Flow, or DCF, model estimates what a business might be worth today by projecting its future cash flows and discounting them back to the present.
For SolarEdge Technologies, the model uses a 2 Stage Free Cash Flow to Equity approach based on cash flow projections. The latest twelve month free cash flow is about $22.88 million. Analysts provide explicit forecasts for several years, and Simply Wall St then extrapolates further, with projected free cash flow of $216.00 million in 2030 and a series of annual estimates between 2026 and 2035 that are discounted back to today.
When these cash flows are added up and adjusted using the DCF method, the estimated intrinsic value comes out at about $22.32 per share. Compared with the recent share price of around $33.34, the model suggests the stock is about 49.4% above this estimate, which points to it being overvalued on this measure alone.
Result: OVERVALUED
Our Discounted Cash Flow (DCF) analysis suggests SolarEdge Technologies may be overvalued by 49.4%. Discover 881 undervalued stocks or create your own screener to find better value opportunities.
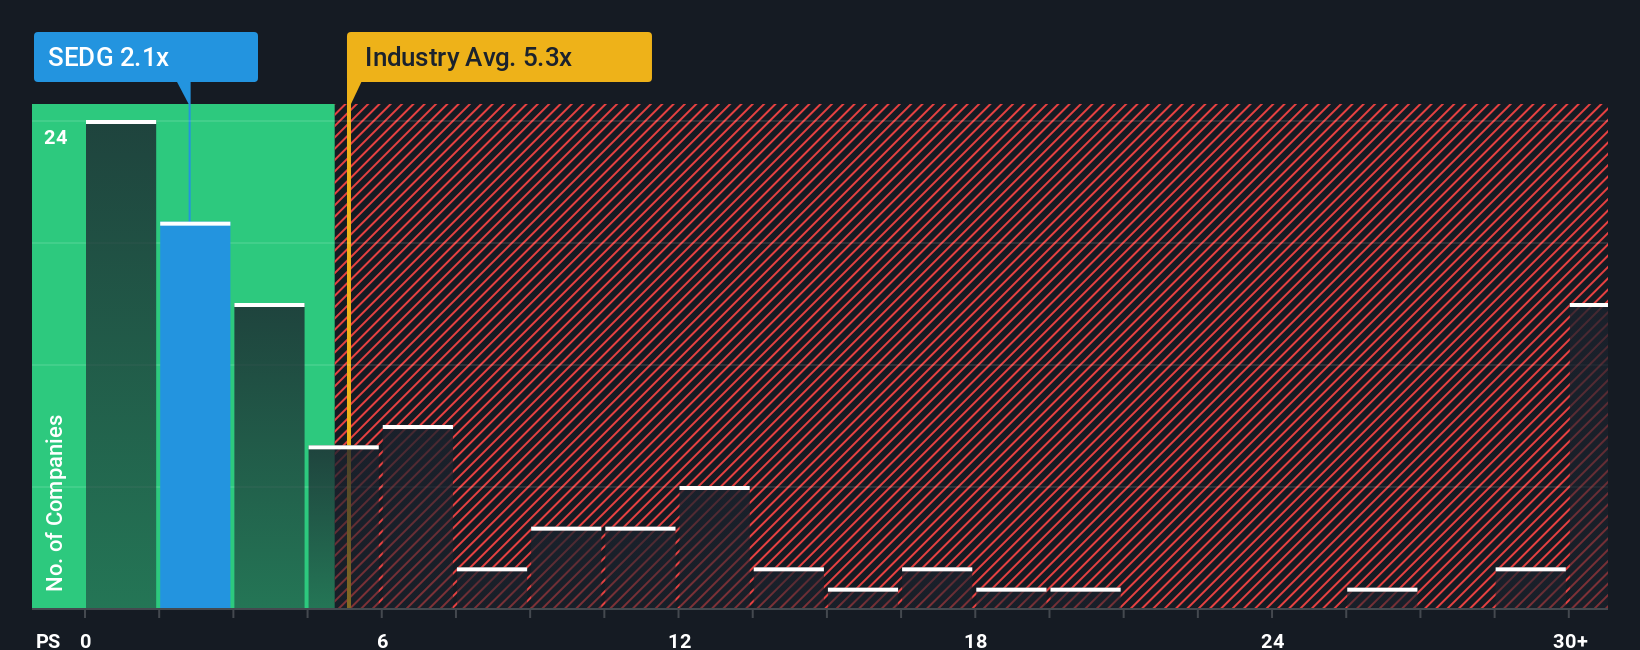
Approach 2: SolarEdge Technologies Price vs Sales
For companies where earnings are weak or volatile, the price-to-sales (P/S) ratio is often more useful than the price-to-earnings (P/E) ratio because it compares the share price to revenue, which is usually more stable and less affected by short term swings in profitability.
Growth expectations and risk still matter here, because investors may accept a higher P/S ratio if they expect stronger future growth, steadier margins or see the business as lower risk, and a lower P/S ratio if they see the opposite.
SolarEdge Technologies currently trades on a P/S ratio of about 1.91x, compared with the Semiconductor industry average of 6.32x and a peer average of 2.91x. Simply Wall St also calculates a proprietary “Fair Ratio” of 1.86x, which is the P/S multiple you might expect based on factors such as the company’s growth profile, profit margins, risks, industry and market capitalization.
This Fair Ratio can be more informative than a simple comparison with peers or the industry, because it adjusts for company specific characteristics instead of assuming all businesses deserve the same multiple. With the current 1.91x P/S sitting slightly above the 1.86x Fair Ratio, the shares appear mildly overvalued on this measure.
Result: OVERVALUED
P/S ratios tell one story, but what if the real opportunity lies elsewhere? Discover 1447 companies where insiders are betting big on explosive growth.
Upgrade Your Decision Making: Choose Your SolarEdge Technologies Narrative
Earlier we mentioned that there is an even better way to understand valuation, so let us introduce you to Narratives. These are simply your story about a company tied directly to the numbers you think are fair for its future revenue, earnings and margins.
A Narrative on Simply Wall St links what you believe about SolarEdge Technologies' business to a financial forecast and then to a fair value estimate. You can compare this with today’s share price to decide whether it looks attractive, expensive, or somewhere in between.
You create or select a Narrative inside the Community page on the platform, which is used by millions of investors. The fair value it produces updates automatically when new information such as earnings reports or major news is added, so your view does not get stuck on outdated assumptions.
For SolarEdge Technologies, one investor might build a Narrative that supports a much higher fair value based on confident assumptions about future cash flows and margins. Another might set a far lower fair value using more cautious estimates and a higher discount rate. That gap in views is what makes Narratives so useful for clarifying your own decision making.
Do you think there's more to the story for SolarEdge Technologies? Head over to our Community to see what others are saying!
This article by Simply Wall St is general in nature. We provide commentary based on historical data and analyst forecasts only using an unbiased methodology and our articles are not intended to be financial advice. It does not constitute a recommendation to buy or sell any stock, and does not take account of your objectives, or your financial situation. We aim to bring you long-term focused analysis driven by fundamental data. Note that our analysis may not factor in the latest price-sensitive company announcements or qualitative material. Simply Wall St has no position in any stocks mentioned.
Have feedback on this article? Concerned about the content? Get in touch with us directly. Alternatively, email editorial-team@simplywallst.com