
- LIVE QUOTES
- LEARN
- HELP
 Nasdaq
 Wall Street Journal
EN
MakeMyTrip Q3 2026 Margin Slide Tests Bullish Growth Narratives
How MakeMyTrip's Latest Numbers Set the Stage for the Current Market Story
MakeMyTrip (NasdaqGS:MMYT) has posted Q3 2026 revenue of US$295.7 million with basic EPS of US$0.07, setting a fresh marker for investors assessing the travel platform's earnings trajectory. The company has seen quarterly revenue move from US$210.99 million in Q2 2025 to US$295.7 million in Q3 2026, while basic EPS has ranged from US$0.16 in Q2 2025 to US$0.07 in the latest quarter, including a loss of US$0.06 per share in Q2 2026. With trailing net profit margin at 5.5% against 25.4% a year earlier, the headline results put profitability quality and margin resilience firmly in focus for shareholders.
See our full analysis for MakeMyTrip.With the numbers on the table, the next step is to see how this earnings print lines up with the prevailing narratives around MakeMyTrip's growth potential, risks, and long term profitability story.
Curious how numbers become stories that shape markets? Explore Community Narratives
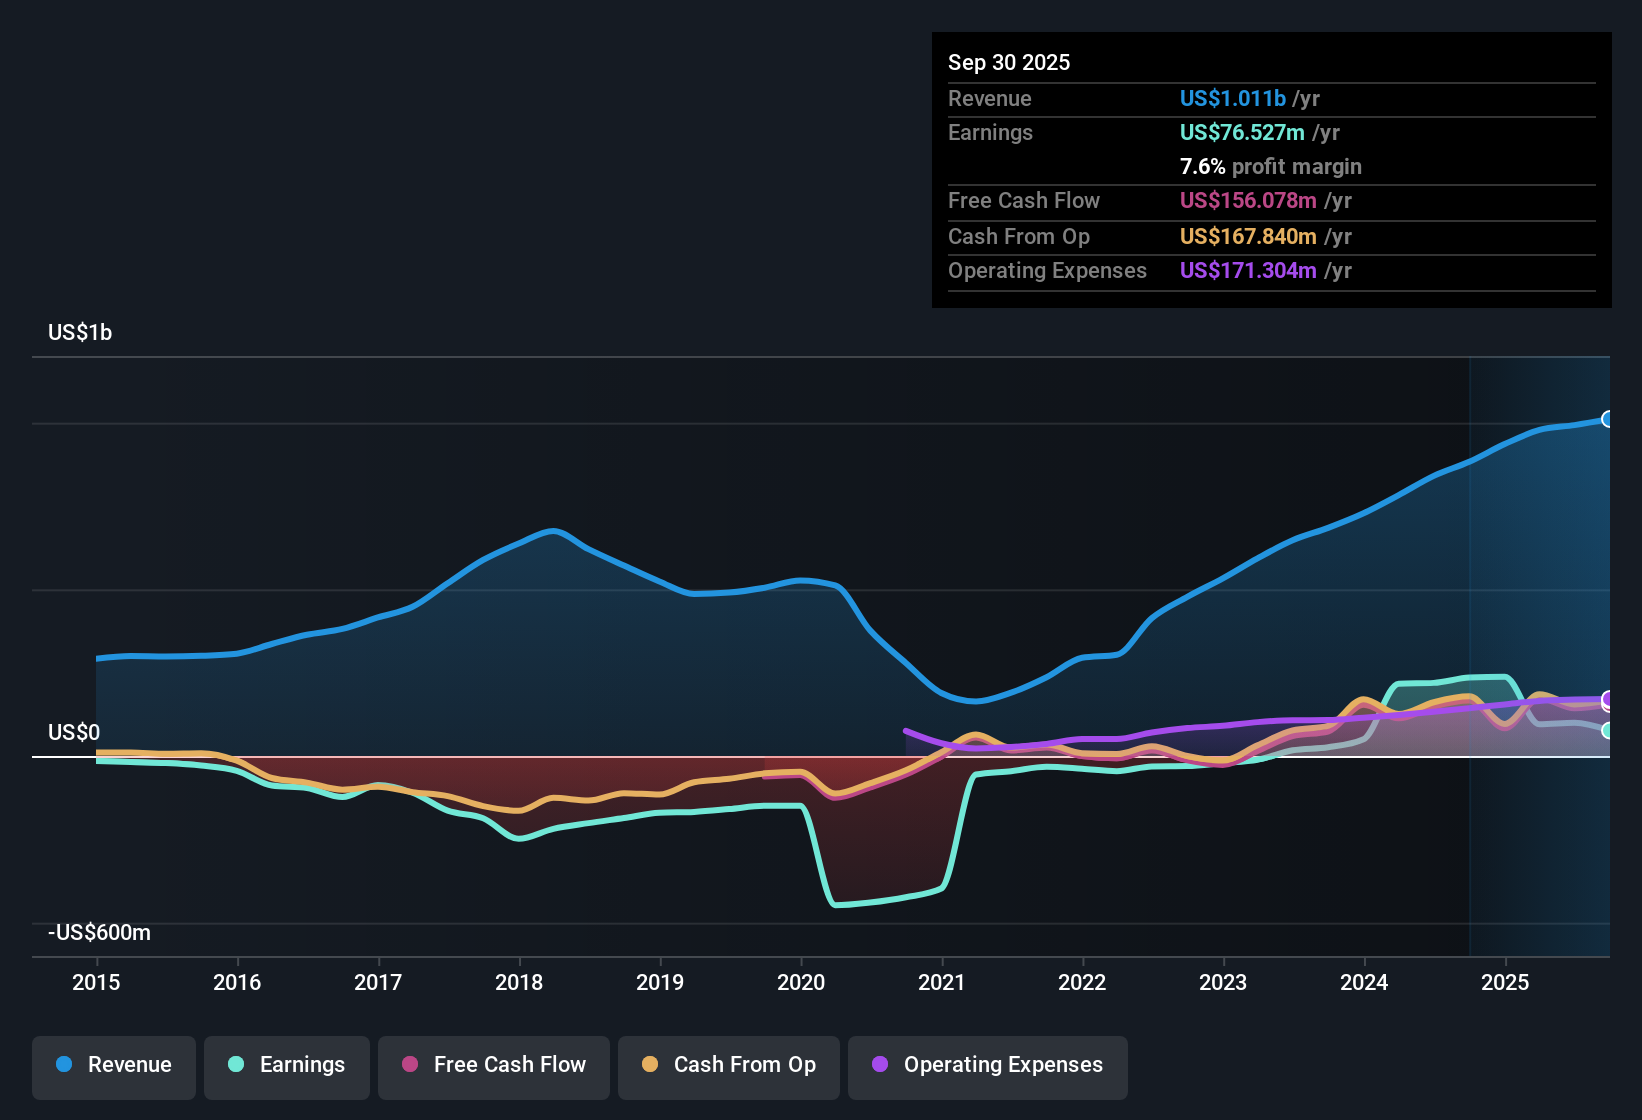
Margins Tighten From 25.4% To 5.5%
- On a trailing basis, net profit margin sits at 5.5% compared with 25.4% a year ago, while trailing net income over the last four reported quarters is US$56.8 million on US$1.0b of revenue.
- Bears point to the margin slide as a concern, and the numbers highlight that tension:
- Quarterly net income moved from US$27.0 million in Q3 2025 to US$7.2 million in Q3 2026, even though revenue rose from US$267.4 million to US$295.7 million over those quarters.
- Over the same stretch, trailing net income shifted from US$237.9 million in the period ending Q3 2025 to US$56.8 million in the latest trailing window, which sits alongside the lower 5.5% margin.
Q3 Profit Rebound After Prior Loss
- Q3 2026 net income was US$7.2 million and basic EPS was US$0.07 after a reported loss of US$5.6 million and basic EPS of US$0.06 in Q2 2026, with revenue moving from US$229.3 million in Q2 2026 to US$295.7 million in Q3 2026.
- Supporters of a more upbeat view see the swing back to profit as helpful background to growth forecasts:
- Earnings are forecast to grow about 48.6% per year while revenue is forecast to grow around 19.4% per year, set against the return to positive net income in the latest quarter.
- Across the last six reported quarters, MakeMyTrip stayed profitable in five of them, with quarterly net income figures of US$17.9 million to US$29.2 million in 2025 and US$25.9 million in Q1 2026 before the temporary Q2 2026 loss.
Rich P/E And DCF Gap At US$65.54
- The shares trade on a trailing P/E of about 109.6x at a price of US$65.54, compared with peer P/E of roughly 18x and industry P/E of about 21.2x, while the DCF fair value is US$44.84 and analysts’ average target sits at US$106.10.
- Critics highlight valuation and balance sheet pressures, and the data backs why they focus on these:
- The current price is above the DCF fair value of US$44.84 and yet well below the US$106.10 analyst target, so investors are weighing a higher multiple against both metrics at once.
- On top of the premium P/E, earnings are not covering interest payments comfortably and there is negative shareholders’ equity flagged in the risk summary, which both sit alongside the compressed 5.5% trailing net margin.
Next Steps
Don't just look at this quarter; the real story is in the long-term trend. We've done an in-depth analysis on MakeMyTrip's growth and its valuation to see if today's price is a bargain. Add the company to your watchlist or portfolio now so you don't miss the next big move.
See What Else Is Out There
MakeMyTrip's premium 109.6x P/E, compressed 5.5% net margin, and balance sheet concerns around interest coverage and negative equity give some investors pause.
If you would rather focus on companies with healthier cushions and less financial strain, check out solid balance sheet and fundamentals stocks screener (391 results) today to find businesses built on stronger balance sheets and more comfortable coverage.
This article by Simply Wall St is general in nature. We provide commentary based on historical data and analyst forecasts only using an unbiased methodology and our articles are not intended to be financial advice. It does not constitute a recommendation to buy or sell any stock, and does not take account of your objectives, or your financial situation. We aim to bring you long-term focused analysis driven by fundamental data. Note that our analysis may not factor in the latest price-sensitive company announcements or qualitative material. Simply Wall St has no position in any stocks mentioned.
Have feedback on this article? Concerned about the content? Get in touch with us directly. Alternatively, email editorial-team@simplywallst.com