
- LIVE QUOTES
- LEARN
- HELP
 Nasdaq
 Wall Street Journal
EN
Kimbell Royalty Partners (KRP) Valuation Check After Mixed Quarterly Results And Ongoing Analyst Scrutiny
Event driven update on Kimbell Royalty Partners
Kimbell Royalty Partners (KRP) is back in focus after its latest quarterly update showed higher revenue than a year ago along with lower net profit, keeping Bank of America Securities’ cautious stance in the spotlight for investors.
See our latest analysis for Kimbell Royalty Partners.
The shares are trading at US$12.59 after a 1 day share price return of 2.69%, with a 30 day share price return of 9.29%, a 1 year total shareholder return of 10.83%, and a 5 year total shareholder return of 150.37%. This suggests that recent momentum contrasts with a much stronger long term record.
If Kimbell’s latest move has you thinking about other parts of the energy patch, it could be a good moment to widen your search with aerospace and defense stocks.
With Kimbell showing revenue growth but a net loss, and the current US$12.59 price sitting below several analyst targets, the real question is whether you are looking at an undervalued royalty play or a market that already prices in future growth.
Price-to-Sales of 3.7x: Is it justified?
On a P/S basis, Kimbell Royalty Partners trades at 3.7x, while our data suggests both peers and a fair P/S level sit meaningfully lower.
The P/S ratio compares the company’s market value to its revenue, and is often used for businesses where earnings are volatile or currently negative. For a royalty partnership like Kimbell, it provides a quick sense of how much investors are paying for each dollar of current sales, rather than profits that are not yet consistently positive.
Here, Kimbell’s 3.7x P/S is described as expensive versus the US oil and gas industry average of 1.5x and a peer average of 3x. This points to a premium pricing of its revenue base. It is also flagged as expensive against an estimated fair P/S ratio of 3.3x, a level the market could potentially move toward if sentiment or expectations change.
Explore the SWS fair ratio for Kimbell Royalty Partners
Result: Price-to-Sales of 3.7x (OVERVALUED)
However, the recent net loss of US$0.91 million and a 1 year total return decline of 10.83% could challenge the idea that the premium P/S is sustainable.
Find out about the key risks to this Kimbell Royalty Partners narrative.
Another view: DCF points in the opposite direction
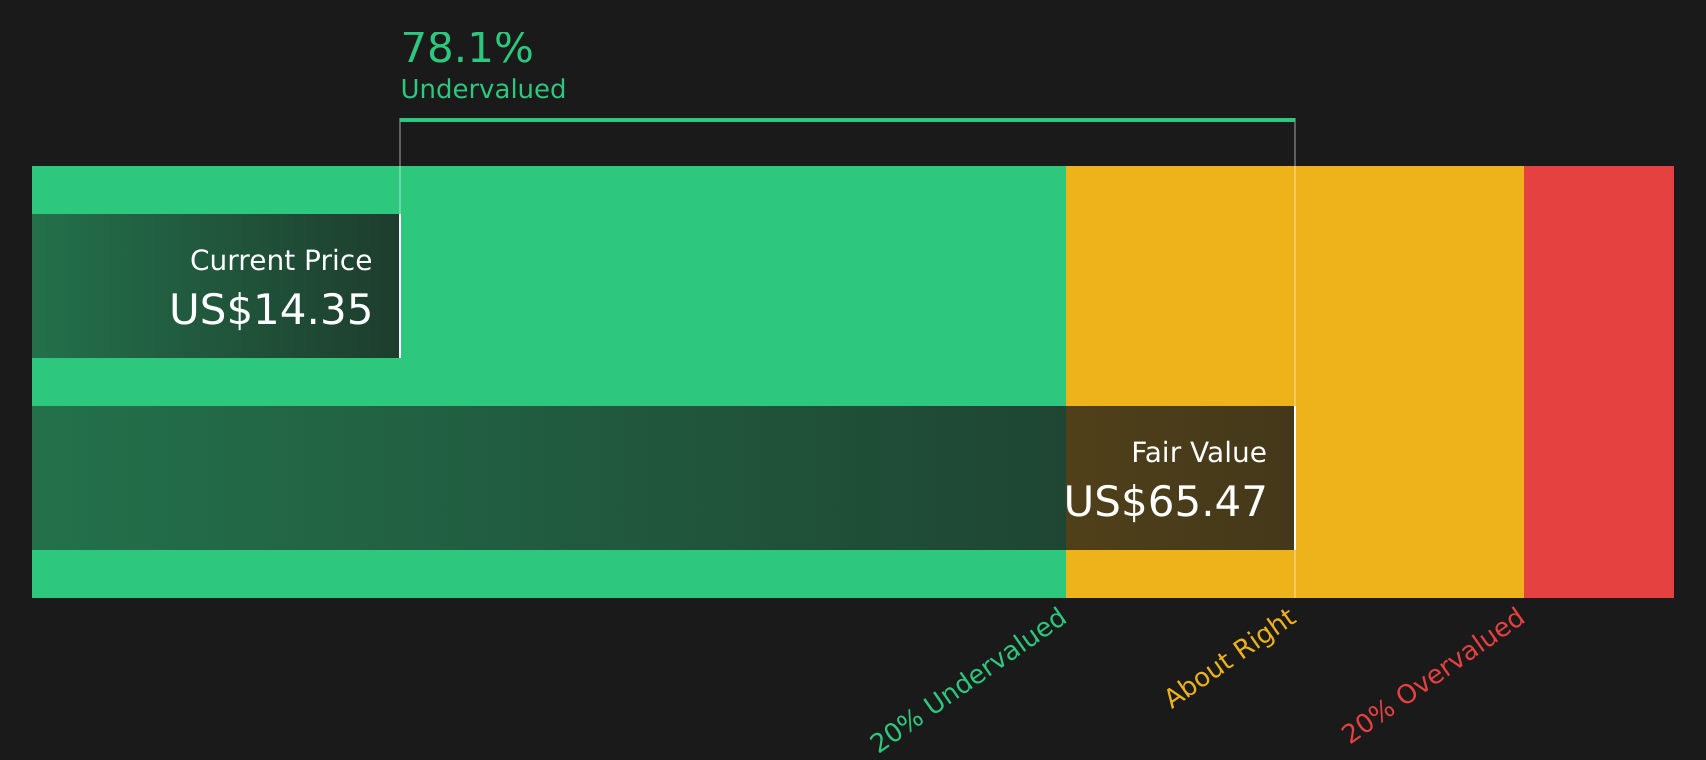
While the 3.7x P/S ratio presents Kimbell Royalty Partners as expensive relative to peers and the industry, the DCF model referenced here points the other way. With the shares at US$12.59 and the referenced future cash flow value at US$63.44, that model indicates a substantial potential undervaluation.
This gap highlights a core question for you as an investor: are current profits and headline multiples the better guide, or does the cash flow outlook provide a more useful perspective on what Kimbell might be worth over time?
Look into how the SWS DCF model arrives at its fair value.
Simply Wall St performs a discounted cash flow (DCF) on every stock in the world every day (check out Kimbell Royalty Partners for example). We show the entire calculation in full. You can track the result in your watchlist or portfolio and be alerted when this changes, or use our stock screener to discover 881 undervalued stocks based on their cash flows. If you save a screener we even alert you when new companies match - so you never miss a potential opportunity.
Build Your Own Kimbell Royalty Partners Narrative
If you see the numbers differently or prefer to work through the assumptions yourself, you can build a custom view in just a few minutes with Do it your way.
A great starting point for your Kimbell Royalty Partners research is our analysis highlighting 2 key rewards and 1 important warning sign that could impact your investment decision.
Looking for more investment ideas?
If Kimbell has sharpened your focus on where to put your next dollar, do not stop here. Widen your watchlist before the next move passes you by.
- Target cash flow potential with these 881 undervalued stocks based on cash flows to screen for companies trading below what their fundamentals might suggest.
- Spot fast moving themes in digital assets by checking out these 19 cryptocurrency and blockchain stocks focused on cryptocurrency and blockchain related businesses.
- Strengthen your income stream with these 13 dividend stocks with yields > 3% to highlight companies offering dividend yields above 3%.
This article by Simply Wall St is general in nature. We provide commentary based on historical data and analyst forecasts only using an unbiased methodology and our articles are not intended to be financial advice. It does not constitute a recommendation to buy or sell any stock, and does not take account of your objectives, or your financial situation. We aim to bring you long-term focused analysis driven by fundamental data. Note that our analysis may not factor in the latest price-sensitive company announcements or qualitative material. Simply Wall St has no position in any stocks mentioned.
Have feedback on this article? Concerned about the content? Get in touch with us directly. Alternatively, email editorial-team@simplywallst.com