
- LIVE QUOTES
- LEARN
- HELP
 Nasdaq
 Wall Street Journal
EN
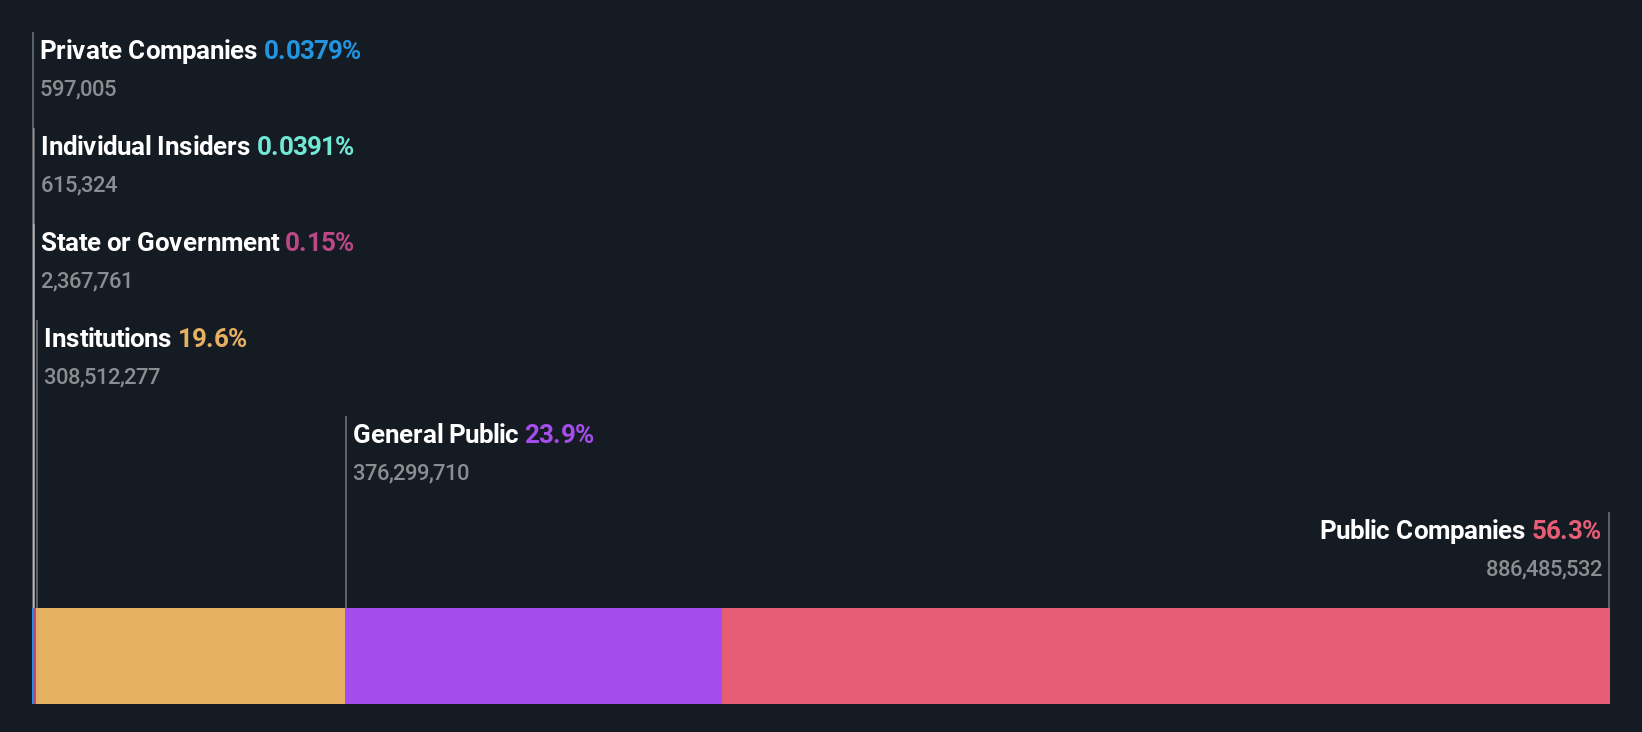
CG Power and Industrial Solutions Limited's (NSE:CGPOWER) top owners are public companies with 56% stake, while 24% is held by individual investors
Key Insights
- Significant control over CG Power and Industrial Solutions by public companies implies that the general public has more power to influence management and governance-related decisions
- Tube Investments of India Limited owns 56% of the company
- 20% of CG Power and Industrial Solutions is held by Institutions
Every investor in CG Power and Industrial Solutions Limited (NSE:CGPOWER) should be aware of the most powerful shareholder groups. And the group that holds the biggest piece of the pie are public companies with 56% ownership. That is, the group stands to benefit the most if the stock rises (or lose the most if there is a downturn).
Meanwhile, individual investors make up 24% of the company’s shareholders.
Let's delve deeper into each type of owner of CG Power and Industrial Solutions, beginning with the chart below.
See our latest analysis for CG Power and Industrial Solutions
What Does The Institutional Ownership Tell Us About CG Power and Industrial Solutions?
Many institutions measure their performance against an index that approximates the local market. So they usually pay more attention to companies that are included in major indices.
CG Power and Industrial Solutions already has institutions on the share registry. Indeed, they own a respectable stake in the company. This can indicate that the company has a certain degree of credibility in the investment community. However, it is best to be wary of relying on the supposed validation that comes with institutional investors. They too, get it wrong sometimes. When multiple institutions own a stock, there's always a risk that they are in a 'crowded trade'. When such a trade goes wrong, multiple parties may compete to sell stock fast. This risk is higher in a company without a history of growth. You can see CG Power and Industrial Solutions' historic earnings and revenue below, but keep in mind there's always more to the story.

Hedge funds don't have many shares in CG Power and Industrial Solutions. The company's largest shareholder is Tube Investments of India Limited, with ownership of 56%. This essentially means that they have extensive influence, if not outright control, over the future of the corporation. In comparison, the second and third largest shareholders hold about 2.9% and 1.9% of the stock.
While it makes sense to study institutional ownership data for a company, it also makes sense to study analyst sentiments to know which way the wind is blowing. There are a reasonable number of analysts covering the stock, so it might be useful to find out their aggregate view on the future.
Insider Ownership Of CG Power and Industrial Solutions
The definition of an insider can differ slightly between different countries, but members of the board of directors always count. Company management run the business, but the CEO will answer to the board, even if he or she is a member of it.
Insider ownership is positive when it signals leadership are thinking like the true owners of the company. However, high insider ownership can also give immense power to a small group within the company. This can be negative in some circumstances.
Our most recent data indicates that insiders own less than 1% of CG Power and Industrial Solutions Limited. As it is a large company, we'd only expect insiders to own a small percentage of it. But it's worth noting that they own ₹363m worth of shares. It is good to see board members owning shares, but it might be worth checking if those insiders have been buying.
General Public Ownership
With a 24% ownership, the general public, mostly comprising of individual investors, have some degree of sway over CG Power and Industrial Solutions. While this size of ownership may not be enough to sway a policy decision in their favour, they can still make a collective impact on company policies.
Public Company Ownership
Public companies currently own 56% of CG Power and Industrial Solutions stock. It's hard to say for sure but this suggests they have entwined business interests. This might be a strategic stake, so it's worth watching this space for changes in ownership.
Next Steps:
It's always worth thinking about the different groups who own shares in a company. But to understand CG Power and Industrial Solutions better, we need to consider many other factors. Consider for instance, the ever-present spectre of investment risk. We've identified 1 warning sign with CG Power and Industrial Solutions , and understanding them should be part of your investment process.
Ultimately the future is most important. You can access this free report on analyst forecasts for the company.
NB: Figures in this article are calculated using data from the last twelve months, which refer to the 12-month period ending on the last date of the month the financial statement is dated. This may not be consistent with full year annual report figures.
Have feedback on this article? Concerned about the content? Get in touch with us directly. Alternatively, email editorial-team (at) simplywallst.com.
This article by Simply Wall St is general in nature. We provide commentary based on historical data and analyst forecasts only using an unbiased methodology and our articles are not intended to be financial advice. It does not constitute a recommendation to buy or sell any stock, and does not take account of your objectives, or your financial situation. We aim to bring you long-term focused analysis driven by fundamental data. Note that our analysis may not factor in the latest price-sensitive company announcements or qualitative material. Simply Wall St has no position in any stocks mentioned.