
- LIVE QUOTES
- LEARN
- HELP
 Nasdaq
 Wall Street Journal
EN
A Look At St. Joe (JOE) Valuation As Migration Tailwinds And Capital Returns Draw Investor Interest
Recent commentary around St. Joe (JOE) has zeroed in on its exposure to internal migration into Florida’s panhandle, along with ongoing share buybacks and a dividend increase that together are drawing fresh attention from investors.
See our latest analysis for St. Joe.
At a share price of US$65.39, St. Joe’s recent 30-day share price return of 6.67% and 90-day gain of 33.97% suggest momentum has been building, while its 1-year total shareholder return of 37.44% points to solid longer term performance.
If internal migration and real estate themes interest you, it may be a good moment to widen the lens and check out screener containing None undiscovered stocks with strong fundamentals as potential next ideas.
With an intrinsic value estimate that sits around 18% above the current US$65.39 share price, plus strong recent returns, the key question is whether St. Joe is still undervalued or if the market is already pricing in future growth.
Price-to-Earnings of 36.1x: Is it justified?
St. Joe trades on a P/E of 36.1x, compared with the US real estate industry average of 30.4x. At the current US$65.39 level, the shares are therefore priced at a premium to the sector.
The P/E ratio links what investors are paying today to the company’s current earnings, and it is especially watched for profitable real estate operators like St. Joe. A higher P/E often reflects the market’s willingness to pay more for each dollar of earnings, which can align with expectations around earnings quality and consistency.
In St. Joe’s case, earnings grew 52.8% over the past year, with profit growth of 10.5% per year over the past 5 years and current net profit margins of 21.4% compared with 17.8% last year. That earnings profile helps explain why the market might accept a richer multiple than some peers. Even so, a 36.1x P/E still means investors are paying more for each dollar of earnings than the broader US real estate group on 30.4x.
Compared with the peer average P/E of 45x, however, St. Joe’s 36.1x multiple sits at a discount within its closer comparison set. This suggests the market is pricing its earnings above the wider sector yet below that narrower peer group. This spread between industry, peer average and St. Joe’s own P/E gives you a sense of where the market currently brackets its earnings profile.
See what the numbers say about this price — find out in our valuation breakdown.
Result: Price-to-Earnings of 36.1x (ABOUT RIGHT)
However, you still need to watch for a cooling in Florida panhandle migration or for weaker demand across its Residential and Hospitality segments, which could pressure earnings expectations.
Find out about the key risks to this St. Joe narrative.
Another View: Our DCF Fair Value Check
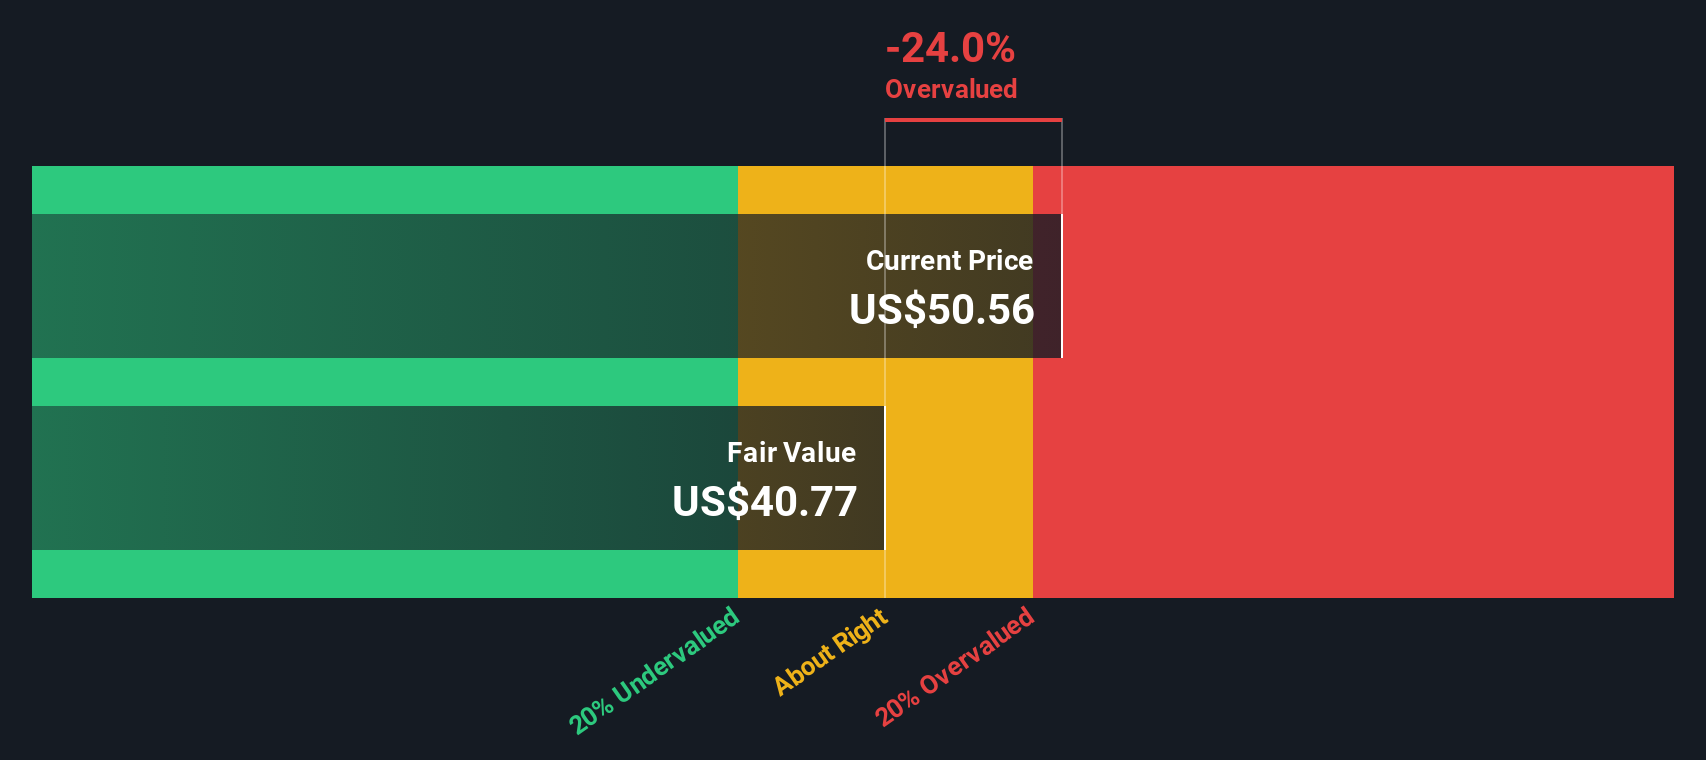
While the 36.1x P/E paints St. Joe as expensive relative to the wider US real estate group, our DCF model points a different way. On that approach, an estimated fair value of US$79.89 versus the current US$65.39 suggests the shares are trading at a discount.
DCF focuses on cash flows rather than current earnings multiples, so it can tell a different story about what the business might be worth today. With one method flagging a premium multiple and another indicating undervaluation, which signal do you weigh more heavily?
Look into how the SWS DCF model arrives at its fair value.
Simply Wall St performs a discounted cash flow (DCF) on every stock in the world every day (check out St. Joe for example). We show the entire calculation in full. You can track the result in your watchlist or portfolio and be alerted when this changes, or use our stock screener to discover 873 undervalued stocks based on their cash flows. If you save a screener we even alert you when new companies match - so you never miss a potential opportunity.
Build Your Own St. Joe Narrative
If you see the data differently or prefer to run your own checks, you can build a fresh St. Joe story yourself in just a few minutes by starting with Do it your way.
A great starting point for your St. Joe research is our analysis highlighting 2 key rewards and 1 important warning sign that could impact your investment decision.
Looking for more investment ideas?
If you have a clear view on St. Joe, now is a smart time to broaden your watchlist with a few focused screens that surface fresh ideas fast.
- Spot potential value opportunities early by checking out these 873 undervalued stocks based on cash flows, where cash flow based pricing does the heavy lifting for you.
- Tap into the intersection of healthcare and technology with these 109 healthcare AI stocks, highlighting companies using AI to tackle real medical problems.
- Lean into digital assets through these 80 cryptocurrency and blockchain stocks, focusing on businesses linked to cryptocurrencies and blockchain rather than the tokens themselves.
This article by Simply Wall St is general in nature. We provide commentary based on historical data and analyst forecasts only using an unbiased methodology and our articles are not intended to be financial advice. It does not constitute a recommendation to buy or sell any stock, and does not take account of your objectives, or your financial situation. We aim to bring you long-term focused analysis driven by fundamental data. Note that our analysis may not factor in the latest price-sensitive company announcements or qualitative material. Simply Wall St has no position in any stocks mentioned.
Have feedback on this article? Concerned about the content? Get in touch with us directly. Alternatively, email editorial-team@simplywallst.com