
- LIVE QUOTES
- LEARN
- HELP
 Nasdaq
 Wall Street Journal
EN
Is It Time To Reassess Energizer (ENR) After A 48% Five Year Share Price Fall?
- If you are wondering whether Energizer Holdings is a potential bargain or a value trap at around US$20.68 per share, you are in the right place.
- The stock has had a mixed run, with a 4.4% decline over the last 7 days, a 1.0% gain over 30 days, a 3.8% gain year to date, a 38.4% decline over 1 year and a 48.0% decline over 5 years.
- These price moves sit against a backdrop of ongoing interest in the household products space. Investors often look for consistent cash generation and resilient brands in this area. For Energizer Holdings, that context is important because sentiment around everyday consumer staples can influence how much investors are willing to pay for each dollar of earnings or sales.
- On our valuation checks, Energizer Holdings scores 5 out of 6, giving it a value score of 5/6. This suggests the stock screens as undervalued on most of the methods we use. Next, we will walk through those different valuation approaches, and then finish with a way of looking at value that can be even more useful than any single model on its own.
Find out why Energizer Holdings's -38.4% return over the last year is lagging behind its peers.
Approach 1: Energizer Holdings Discounted Cash Flow (DCF) Analysis
A Discounted Cash Flow, or DCF, model estimates what a business could be worth today by projecting its future cash flows and then discounting those cash flows back to a present value.
For Energizer Holdings, the model is a 2 Stage Free Cash Flow to Equity approach using cash flow projections in US$. The latest twelve month free cash flow is about $67.0 million. Analysts provide forecasts for the next few years, and beyond that Simply Wall St extrapolates cash flows out to 2035. For example, projected free cash flow for 2030 is $361.0 million, with other years in the 10 year view ranging between roughly $350.0 million and $409.0 million before discounting.
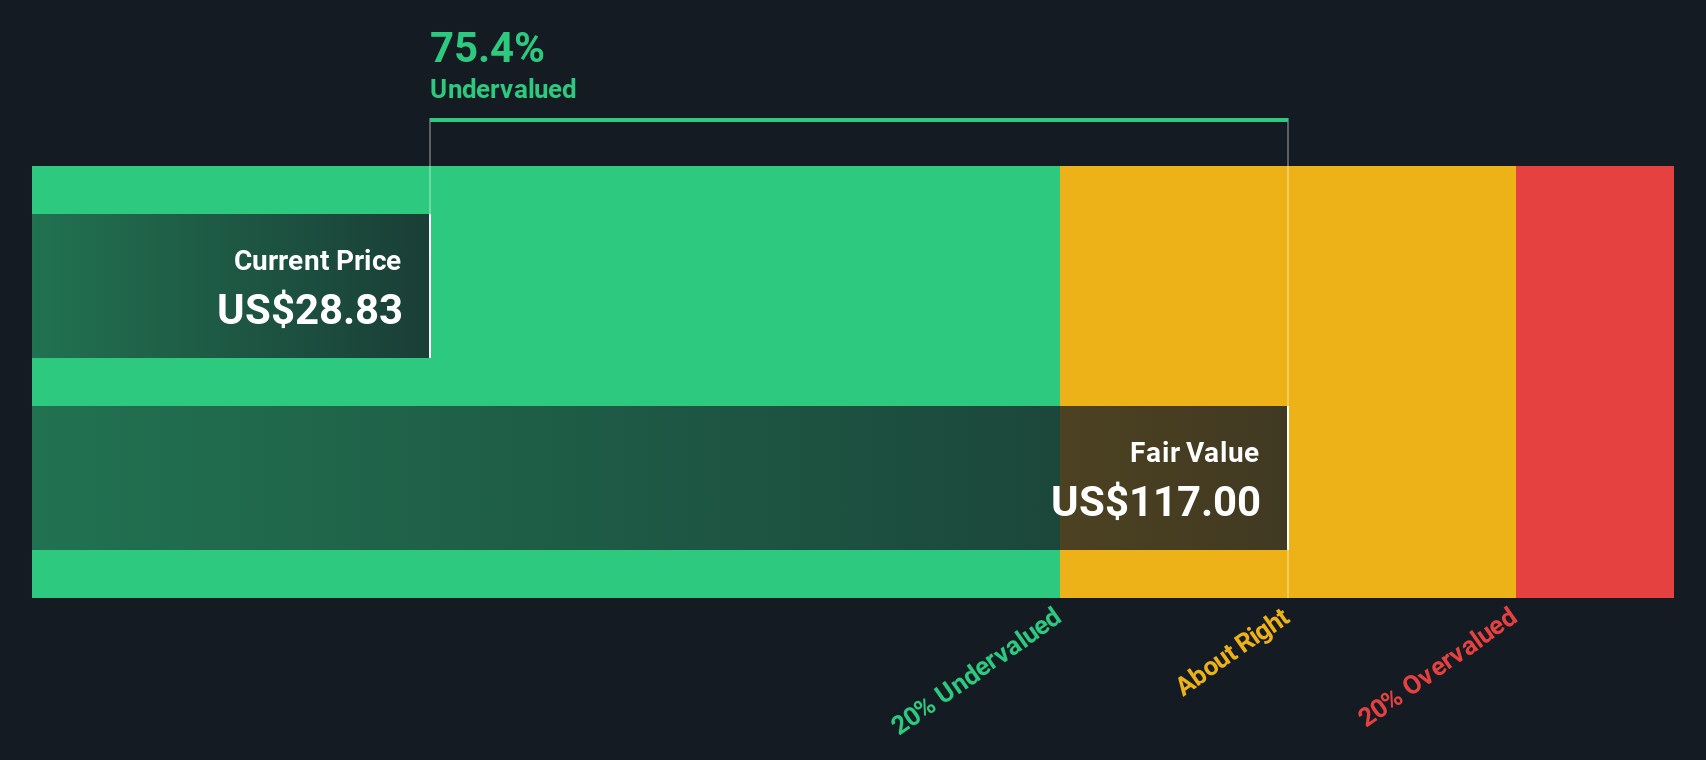
When all those projected cash flows are discounted back and summed, the model produces an estimated intrinsic value of about $94.95 per share. Compared with the current share price of around $20.68, the DCF suggests the stock trades at a 78.2% discount and screens as materially undervalued on this measure.
Result: UNDERVALUED
Our Discounted Cash Flow (DCF) analysis suggests Energizer Holdings is undervalued by 78.2%. Track this in your watchlist or portfolio, or discover 871 more undervalued stocks based on cash flows.
Approach 2: Energizer Holdings Price vs Earnings
For profitable companies like Energizer Holdings, the P/E ratio is a useful way to see how much investors are currently paying for each dollar of earnings. It links directly to what the business is earning today, which many investors find easier to interpret than longer term cash flow estimates.
What counts as a "normal" or "fair" P/E depends on how the market views a company’s growth potential and risk. Higher expected growth or lower perceived risk can justify a higher P/E, while lower growth or higher risk tends to line up with a lower multiple.
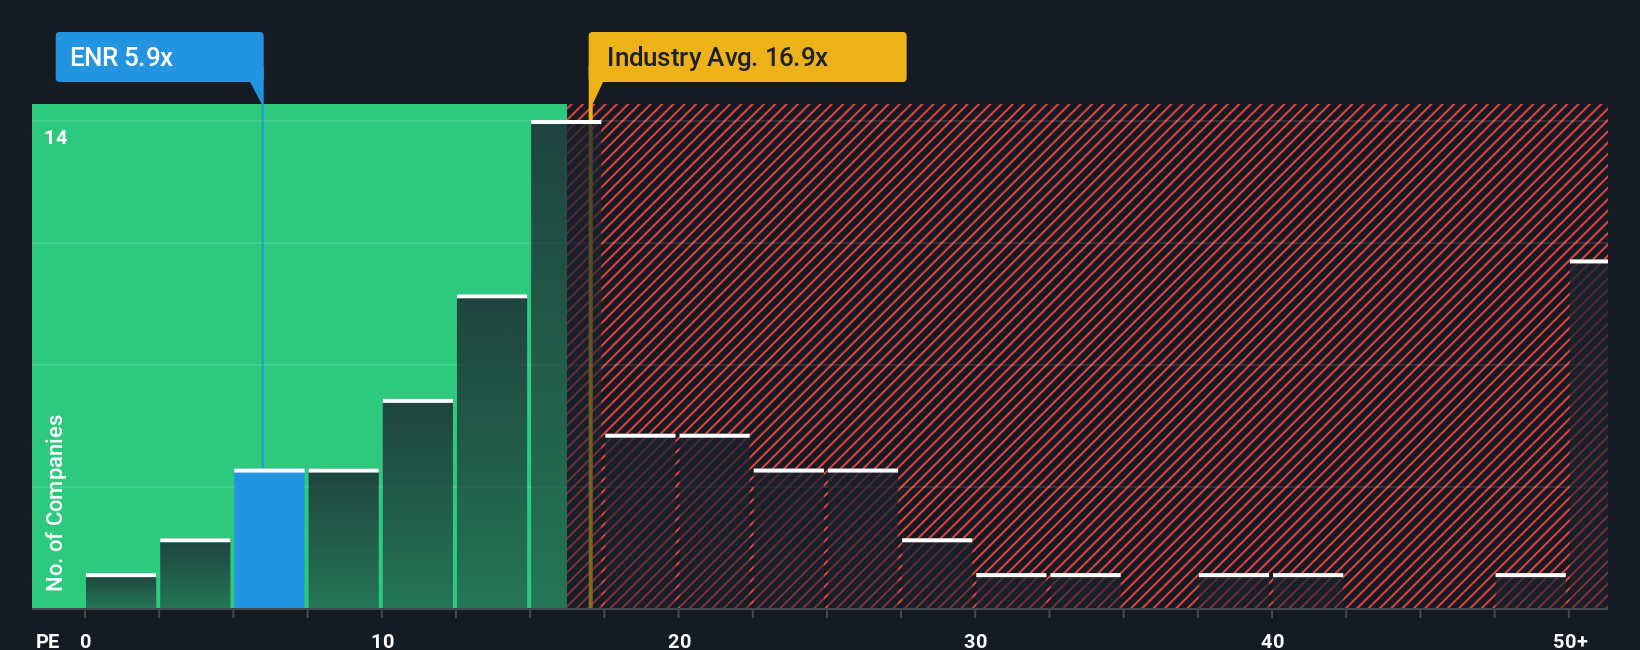
Energizer Holdings is trading on a P/E of 5.9x, compared with the Household Products industry average of about 16.9x and a broader peer average of 18.4x. Simply Wall St also calculates a Fair Ratio of 12.8x. This is the P/E level that might be expected given factors such as earnings growth, industry, profit margins, market cap and company specific risks.
Because the Fair Ratio adjusts for those company characteristics, it can be more informative than a simple comparison with industry averages or peers alone. With the current P/E of 5.9x sitting well below the Fair Ratio of 12.8x, the shares screen as undervalued on this metric.
Result: UNDERVALUED
P/E ratios tell one story, but what if the real opportunity lies elsewhere? Discover 1442 companies where insiders are betting big on explosive growth.
Upgrade Your Decision Making: Choose your Energizer Holdings Narrative
Earlier we mentioned that there is an even better way to understand valuation, so let us introduce you to Narratives.
A Narrative is simply your story about a company, written in numbers, where you connect your view of its products, competition and risks to your assumptions for future revenue, earnings and margins.
On Simply Wall St, Narratives sit inside the Community page and link that story to a full financial forecast and a fair value estimate, so you can quickly compare your Fair Value with the current share price to help decide whether Energizer Holdings looks attractive, fully priced or expensive for you.
Because Narratives on the platform are refreshed when new information like news or earnings is added, your fair value view can stay aligned with what is happening rather than being fixed at one point in time.
For example, one Energizer Holdings Narrative in the Community might assume a very optimistic fair value and profit outlook while another assumes a much more conservative fair value and thinner margins, showing how two investors can look at the same company and reach very different conclusions.
Do you think there's more to the story for Energizer Holdings? Head over to our Community to see what others are saying!

This article by Simply Wall St is general in nature. We provide commentary based on historical data and analyst forecasts only using an unbiased methodology and our articles are not intended to be financial advice. It does not constitute a recommendation to buy or sell any stock, and does not take account of your objectives, or your financial situation. We aim to bring you long-term focused analysis driven by fundamental data. Note that our analysis may not factor in the latest price-sensitive company announcements or qualitative material. Simply Wall St has no position in any stocks mentioned.
Have feedback on this article? Concerned about the content? Get in touch with us directly. Alternatively, email editorial-team@simplywallst.com