
- LIVE QUOTES
- LEARN
- HELP
 Nasdaq
 Wall Street Journal
EN
Is Cleveland-Cliffs (CLF) Offering Value After Recent Share Price Rebound?
- If you are wondering whether Cleveland-Cliffs is offering genuine value at its current price, this article walks through the key numbers that matter for you as a shareholder or potential investor.
- The stock last closed at US$14.00, with returns of 9.7% over 7 days, 8.3% over 30 days, 2.9% year to date, 36.3% over 1 year, and longer term returns of a 33.2% decline over 3 years and a 14.6% decline over 5 years, which can signal changing expectations around both opportunity and risk.
- Recent news coverage around Cleveland-Cliffs has largely focused on its position in the U.S. steel and iron ore market and how investor sentiment has tracked broader materials sector conditions. This mix of sector headlines and company specific attention helps frame why the share price has seen both shorter term strength and weaker multi year returns.
- On our checks, Cleveland-Cliffs scores 5 out of 6 on valuation, and you can see the detailed scorecard here. Next, we will walk through the main valuation methods investors often use, and then finish with a more complete way to think about what that valuation score really means for you.
Find out why Cleveland-Cliffs's 36.3% return over the last year is lagging behind its peers.
Approach 1: Cleveland-Cliffs Discounted Cash Flow (DCF) Analysis
A Discounted Cash Flow, or DCF, model takes estimates of the cash Cleveland-Cliffs might generate in the future and discounts those cash flows back into today’s dollars, aiming to estimate what the whole business could be worth right now.
For Cleveland-Cliffs, the latest twelve month free cash flow is a loss of US$1.53b. Analysts have provided projections that feed into a 2 Stage Free Cash Flow to Equity model, with free cash flow expected to be US$372.67m in 2026 and US$577.50m in 2027, then extended further by Simply Wall St to around US$1.54b by 2035 using gradual growth assumptions.
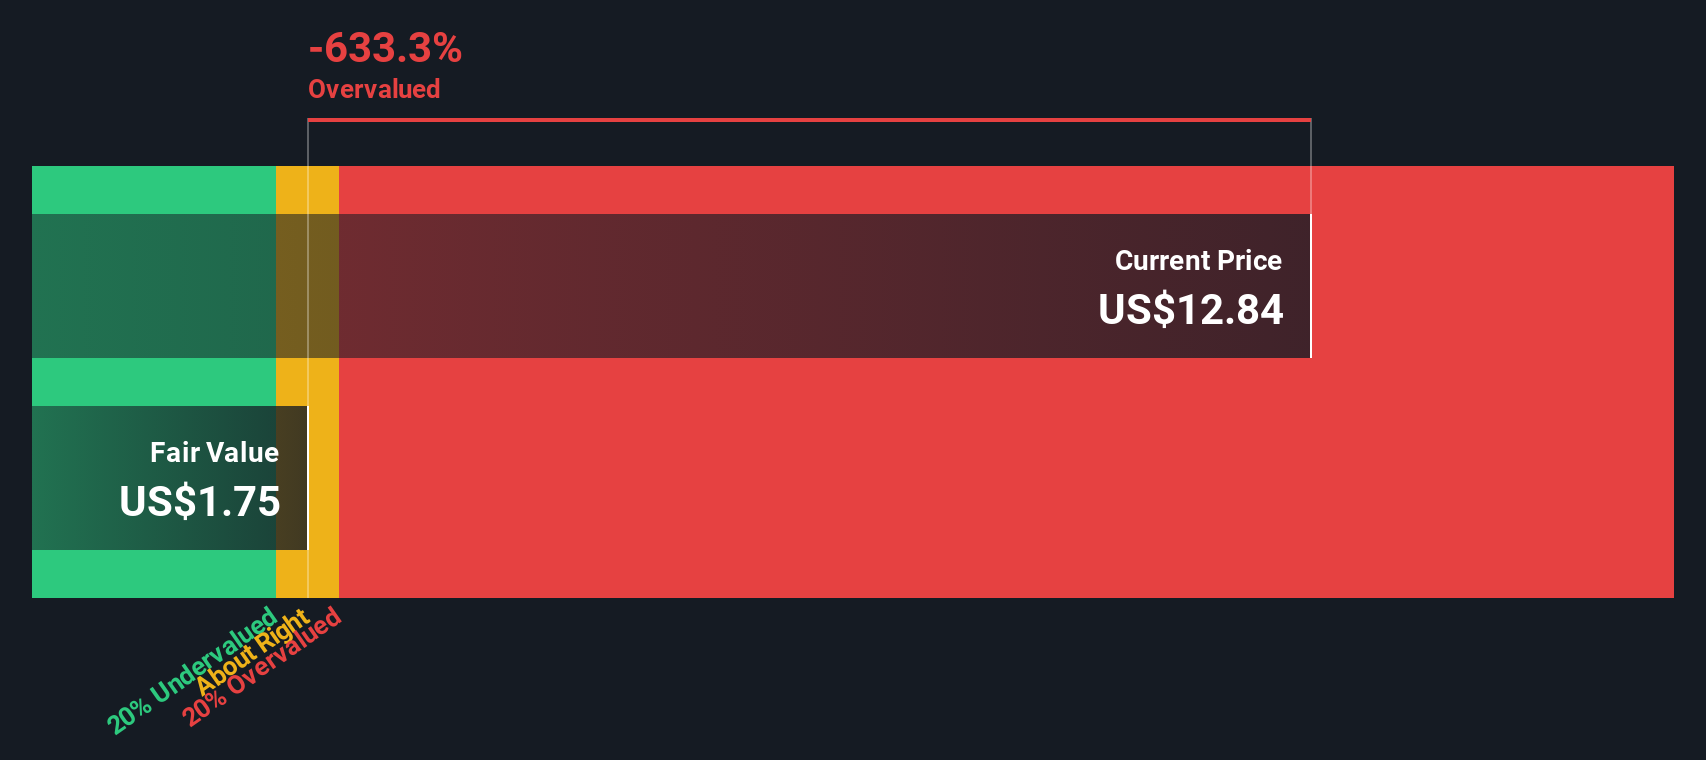
When all those projected cash flows are discounted back and divided by the number of shares, the model arrives at an estimated intrinsic value of about US$21.76 per share. Compared to the recent share price of US$14.00, this suggests the stock is around 35.7% undervalued on this DCF view.
Result: UNDERVALUED
Our Discounted Cash Flow (DCF) analysis suggests Cleveland-Cliffs is undervalued by 35.7%. Track this in your watchlist or portfolio, or discover 871 more undervalued stocks based on cash flows.
Approach 2: Cleveland-Cliffs Price vs Sales
For companies where earnings can be uneven, the P/S ratio is often a useful cross check because it compares the share price to revenue, which tends to be more stable than profits from year to year.
In general, higher growth expectations and lower perceived risk can support a higher “normal” P/S multiple, while slower growth or higher risk usually line up with a lower multiple. So context really matters when you look at any single number.
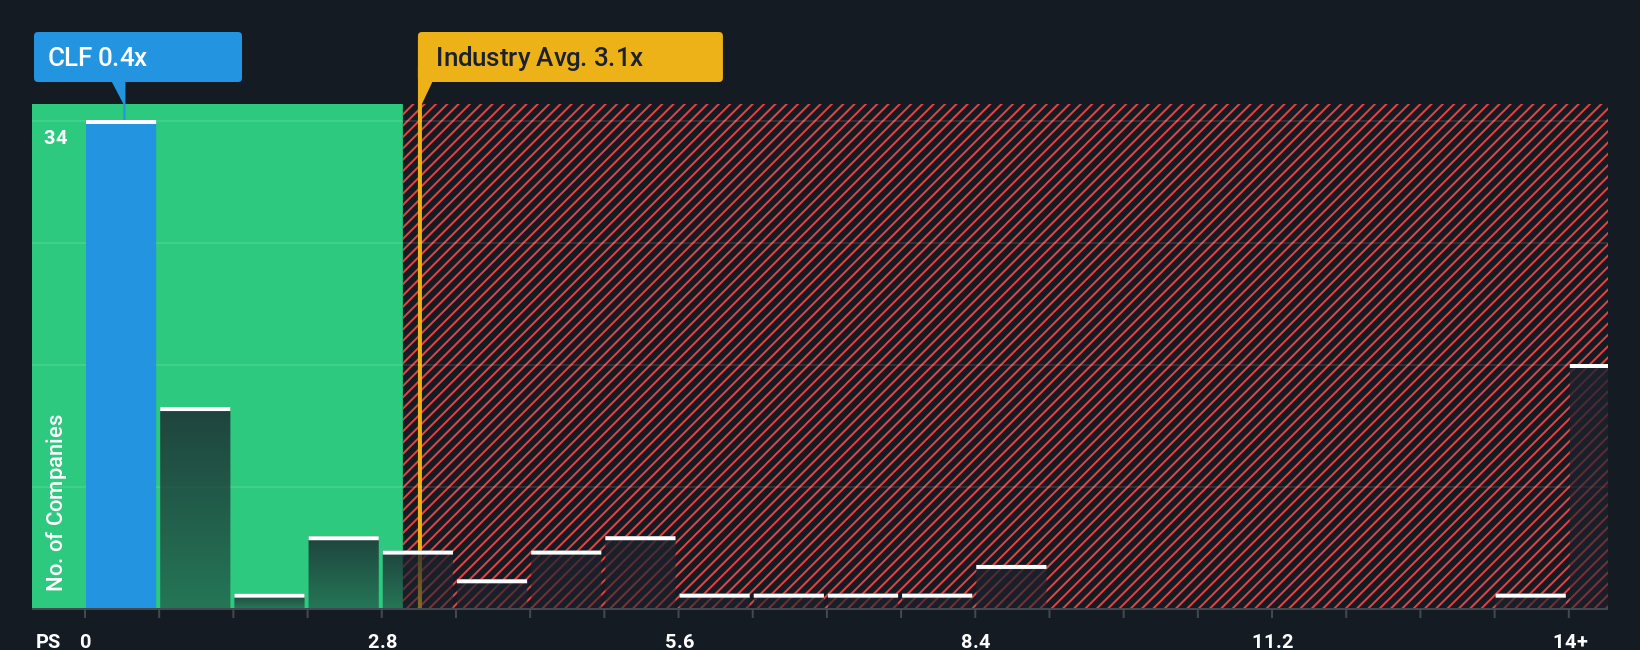
Cleveland-Cliffs currently trades on a P/S of 0.48x. That sits well below both the Metals and Mining industry average of 3.16x and a peer group average of 1.77x. Simply Wall St’s Fair Ratio for Cleveland-Cliffs is 0.62x, which is its proprietary estimate of what a reasonable P/S might be after weighing factors like growth outlook, profit margins, industry, market cap and specific risks.
The Fair Ratio can be more useful than a simple peer or industry comparison because it attempts to adjust for how Cleveland-Cliffs differs from other companies rather than assuming one size fits all. With the current P/S of 0.48x sitting below the Fair Ratio of 0.62x, the shares appear undervalued on this metric.
Result: UNDERVALUED
P/S ratios tell one story, but what if the real opportunity lies elsewhere? Discover 1442 companies where insiders are betting big on explosive growth.
Upgrade Your Decision Making: Choose your Cleveland-Cliffs Narrative
Earlier we mentioned that there is an even better way to understand valuation, so let us introduce you to Narratives, which are simply your story about Cleveland-Cliffs, tied to concrete numbers like your expected revenue, earnings, margins and fair value, then compared with the current price to help you decide whether it looks attractive or stretched.
On Simply Wall St’s Community page, millions of investors can build and share these Narratives as easy to read forecasts that stay linked to the company’s story, so when new earnings, news or analyst updates arrive, the Narrative and its fair value refresh automatically.
For Cleveland-Cliffs, one investor might build a more optimistic Narrative that leans on factors such as tariff protection, cost discipline and specialty steel investments and arrive at a higher fair value closer to the most bullish analyst target of US$14.00. Another investor might focus on risks around tariffs, blast furnace technology and automotive exposure and land nearer the most cautious target of US$5.00. Seeing where your own fair value sits between those viewpoints is what can sharpen your investment decisions.
Do you think there's more to the story for Cleveland-Cliffs? Head over to our Community to see what others are saying!

This article by Simply Wall St is general in nature. We provide commentary based on historical data and analyst forecasts only using an unbiased methodology and our articles are not intended to be financial advice. It does not constitute a recommendation to buy or sell any stock, and does not take account of your objectives, or your financial situation. We aim to bring you long-term focused analysis driven by fundamental data. Note that our analysis may not factor in the latest price-sensitive company announcements or qualitative material. Simply Wall St has no position in any stocks mentioned.
Have feedback on this article? Concerned about the content? Get in touch with us directly. Alternatively, email editorial-team@simplywallst.com