
- LIVE QUOTES
- LEARN
- HELP
 Nasdaq
 Wall Street Journal
EN
A Closer Look At Innoviva (INVA) Valuation As P/E And DCF Signal A Wide Potential Discount
Without a fresh headline catalyst today, Innoviva (INVA) is attracting attention mainly through its recent share performance, valuation metrics and underlying financial profile. Together, these factors give investors a compact snapshot of this US-based pharmaceutical developer.
See our latest analysis for Innoviva.
At a share price of $19.51, Innoviva’s recent 12.19% 90 day share price return contrasts with a weaker year to date move and a 10.35% 1 year total shareholder return. This suggests that momentum has cooled, while longer term holders remain ahead.
If Innoviva has you looking closer at pharmaceuticals, it could be a good moment to broaden your watchlist with pharma stocks with solid dividends as potential income ideas.
So with Innoviva trading at $19.51, at a 64.6% discount to its analyst price target and a 64.6% intrinsic discount, is the market overlooking value here or already pricing in the company’s future growth?
Price-to-Earnings of 11.5x: Is it justified?
At a last close of $19.51 and a P/E of 11.5x, Innoviva screens as undervalued compared to both its peers and the wider US pharmaceuticals group.
The P/E multiple compares the share price to earnings per share. It reflects how much you are paying for each dollar of current earnings. For a company developing and commercializing respiratory and anti infective medicines, this is a common yardstick investors use to judge whether earnings are being priced richly or cheaply.
Here, Innoviva trades at a P/E of 11.5x while the peer average sits at 26.3x and the US pharmaceuticals industry average is 20.1x. The company also screens below an estimated fair P/E of 15.3x, which is a level the market could potentially move toward if sentiment and earnings expectations align more closely with this fair ratio.
Explore the SWS fair ratio for Innoviva
Result: Price-to-Earnings of 11.5x (UNDERVALUED)
However, the story can change quickly if respiratory drug royalties soften or if late stage pipeline assets like Zoliflodacin face clinical or regulatory setbacks.
Find out about the key risks to this Innoviva narrative.
Another View: Our DCF Model Paints A Different Picture
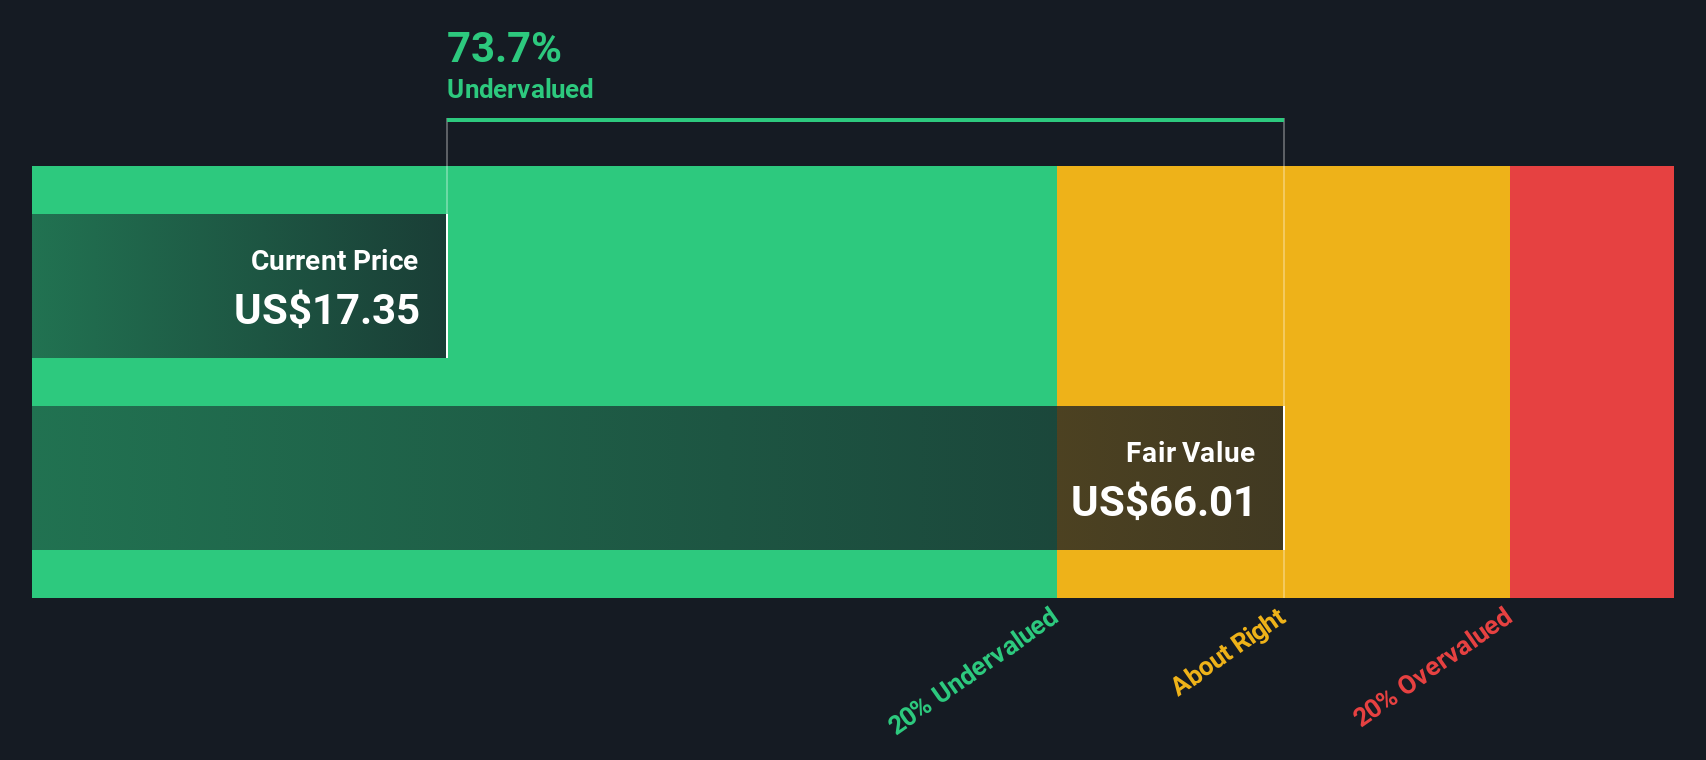
While the 11.5x P/E suggests value when you line Innoviva up against peers and the fair ratio of 15.3x, our DCF model goes further and flags a very wide gap, with fair value estimated at $55.04 versus the current $19.51. That kind of spread raises the question: which signal do you trust more?
Look into how the SWS DCF model arrives at its fair value.
Simply Wall St performs a discounted cash flow (DCF) on every stock in the world every day (check out Innoviva for example). We show the entire calculation in full. You can track the result in your watchlist or portfolio and be alerted when this changes, or use our stock screener to discover 888 undervalued stocks based on their cash flows. If you save a screener we even alert you when new companies match - so you never miss a potential opportunity.
Build Your Own Innoviva Narrative
If you see the numbers differently or want to stress test the assumptions yourself, you can build a tailored view of Innoviva in minutes using Do it your way.
A great starting point for your Innoviva research is our analysis highlighting 4 key rewards and 1 important warning sign that could impact your investment decision.
Looking for more stock ideas to add to your watchlist?
If you are serious about finding the next opportunity, do not stop at one company. Put the Simply Wall St screener to work across a broader set.
- Target reliable cash returns by scanning these 13 dividend stocks with yields > 3% that could help anchor your portfolio income.
- Hunt for potential bargains with these 888 undervalued stocks based on cash flows that may be pricing in more caution than their cash flows suggest.
- Stay ahead of emerging themes by checking out these 79 cryptocurrency and blockchain stocks tied to digital assets and blockchain infrastructure.
This article by Simply Wall St is general in nature. We provide commentary based on historical data and analyst forecasts only using an unbiased methodology and our articles are not intended to be financial advice. It does not constitute a recommendation to buy or sell any stock, and does not take account of your objectives, or your financial situation. We aim to bring you long-term focused analysis driven by fundamental data. Note that our analysis may not factor in the latest price-sensitive company announcements or qualitative material. Simply Wall St has no position in any stocks mentioned.
Have feedback on this article? Concerned about the content? Get in touch with us directly. Alternatively, email editorial-team@simplywallst.com