
- LIVE QUOTES
- LEARN
- HELP
 Nasdaq
 Wall Street Journal
EN
A Look At Valens Semiconductor (VLN) Valuation After New ADAS Wins And E Mirror Launch
Valens Semiconductor (VLN) is back on investor radar after securing a fourth MIPI A PHY design win in China and launching a production ready A PHY enabled e mirror with Sakae Riken Kogyo.
See our latest analysis for Valens Semiconductor.
The recent A PHY design wins and e mirror launch sit against a sharp short term rebound, with a 30 day share price return of 55.97% and year to date share price return of 58.97%. This contrasts with a 1 year total shareholder return decline of 19.48% and a 3 year total shareholder return decline of 51.84%, which suggests momentum has picked up recently even though longer term holders are still facing sizeable losses.
If Valens' ADAS and e mirror traction has you watching semiconductor names more closely, this could be a useful moment to scan other high growth tech and AI stocks that are also seeing rising interest from the market.
With the shares up sharply over the past month but still lower over three and five years, and with ongoing losses alongside recent revenue growth, is Valens Semiconductor now mispriced, or is the market already factoring in future gains?
Most Popular Narrative: 38% Undervalued
Against a last close of US$2.48, the most followed narrative points to a fair value of US$4.00, framing Valens as materially mispriced on future potential.
The increasing proliferation of data-intensive applications such as AI, machine vision, and real-time analytics in automotive and industrial segments is accelerating the industry-wide need for ultra-high-speed, low-latency connectivity. This is positioning Valens's VS3000 and VA7000 chipsets as critical enablers, expected to drive significant topline growth as adoption broadens from high-end/niche to mainstream markets across multiple verticals.
Curious what sits behind that US$4.00 fair value? Revenue projections, margin shifts, and a future earnings multiple all play a central role. The full narrative joins those pieces together.
Result: Fair Value of $4 (UNDERVALUED)
Have a read of the narrative in full and understand what's behind the forecasts.
However, there are still clear pressure points, including reliance on a small group of customers and exposure to tariffs and geopolitical tensions that could limit the upbeat scenario.
Find out about the key risks to this Valens Semiconductor narrative.
Another View: Our DCF Says Slightly Overvalued
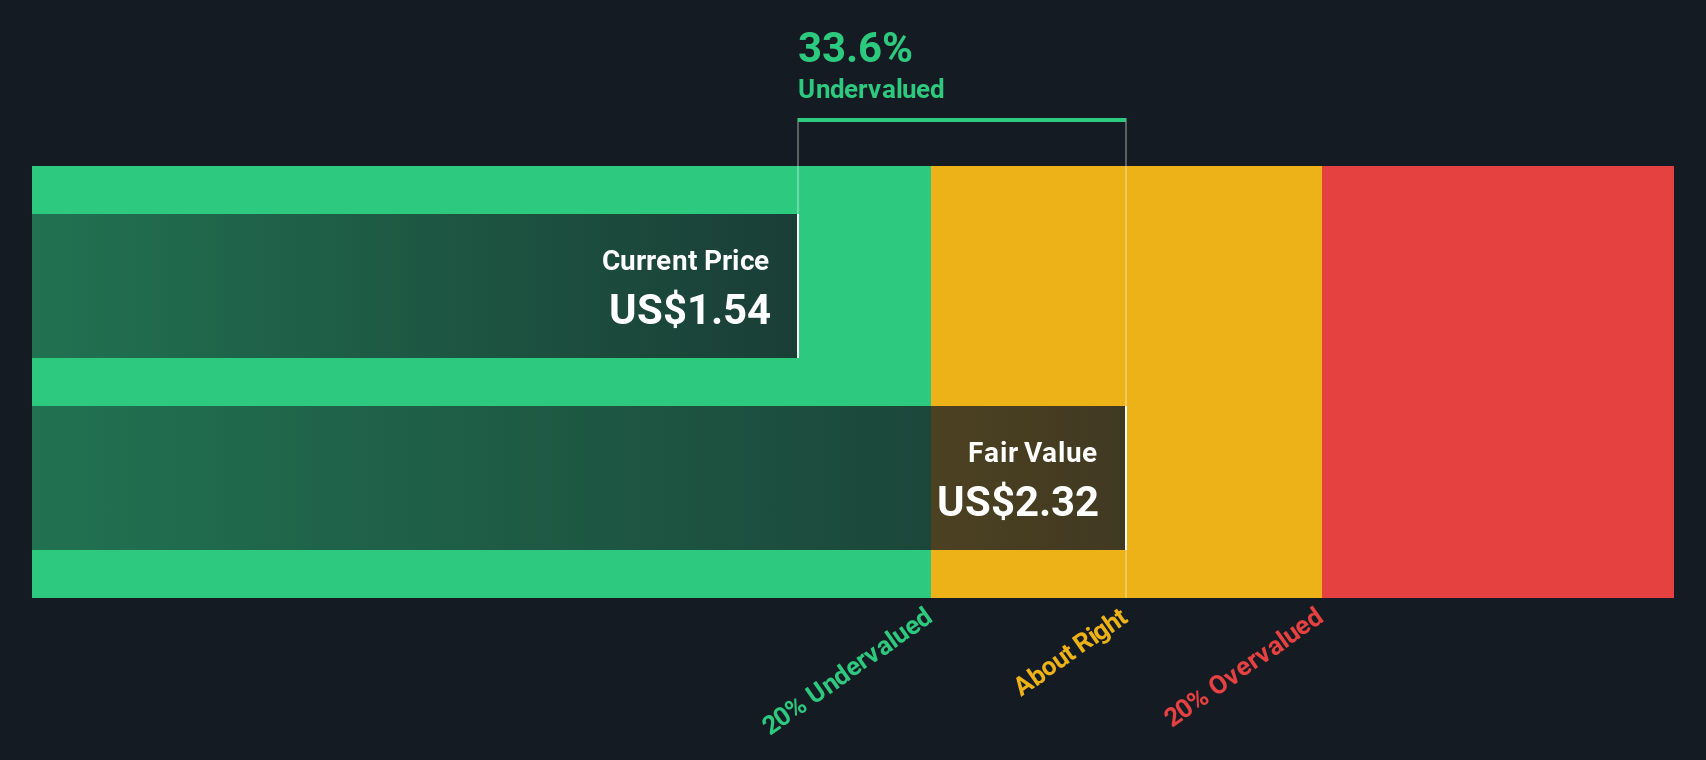
That 38% upside narrative contrasts with the Simply Wall St DCF model, which estimates fair value at about US$2.23 per share, slightly below the current US$2.48 price. On this view, the market may already be pricing in a good portion of the expected growth. Which lens do you find more convincing?
Look into how the SWS DCF model arrives at its fair value.
Simply Wall St performs a discounted cash flow (DCF) on every stock in the world every day (check out Valens Semiconductor for example). We show the entire calculation in full. You can track the result in your watchlist or portfolio and be alerted when this changes, or use our stock screener to discover 882 undervalued stocks based on their cash flows. If you save a screener we even alert you when new companies match - so you never miss a potential opportunity.
Build Your Own Valens Semiconductor Narrative
If you see the numbers differently or prefer to piece together your own view, you can build a complete Valens story yourself in just a few minutes, then Do it your way.
A great starting point for your Valens Semiconductor research is our analysis highlighting 2 key rewards and 2 important warning signs that could impact your investment decision.
Looking for more investment ideas?
If Valens has caught your attention, do not stop there. Use what you have learned to broaden your watchlist with other targeted opportunities.
- Spot potential recovery stories early by scanning these 3539 penny stocks with strong financials that already have the financials to support their share prices.
- Position yourself for long term themes by reviewing these 28 AI penny stocks that are building real businesses around artificial intelligence.
- Hunt for potential mispriced opportunities by checking these 882 undervalued stocks based on cash flows where current prices are evaluated relative to cash flow estimates.
This article by Simply Wall St is general in nature. We provide commentary based on historical data and analyst forecasts only using an unbiased methodology and our articles are not intended to be financial advice. It does not constitute a recommendation to buy or sell any stock, and does not take account of your objectives, or your financial situation. We aim to bring you long-term focused analysis driven by fundamental data. Note that our analysis may not factor in the latest price-sensitive company announcements or qualitative material. Simply Wall St has no position in any stocks mentioned.
Have feedback on this article? Concerned about the content? Get in touch with us directly. Alternatively, email editorial-team@simplywallst.com