
- LIVE QUOTES
- LEARN
- HELP


EN
Is It Too Late To Consider Buying BWX Technologies (BWXT) After A 77% One-Year Surge?
- If you are wondering whether BWX Technologies at around US$201 per share looks expensive or still offers value, you are not alone.
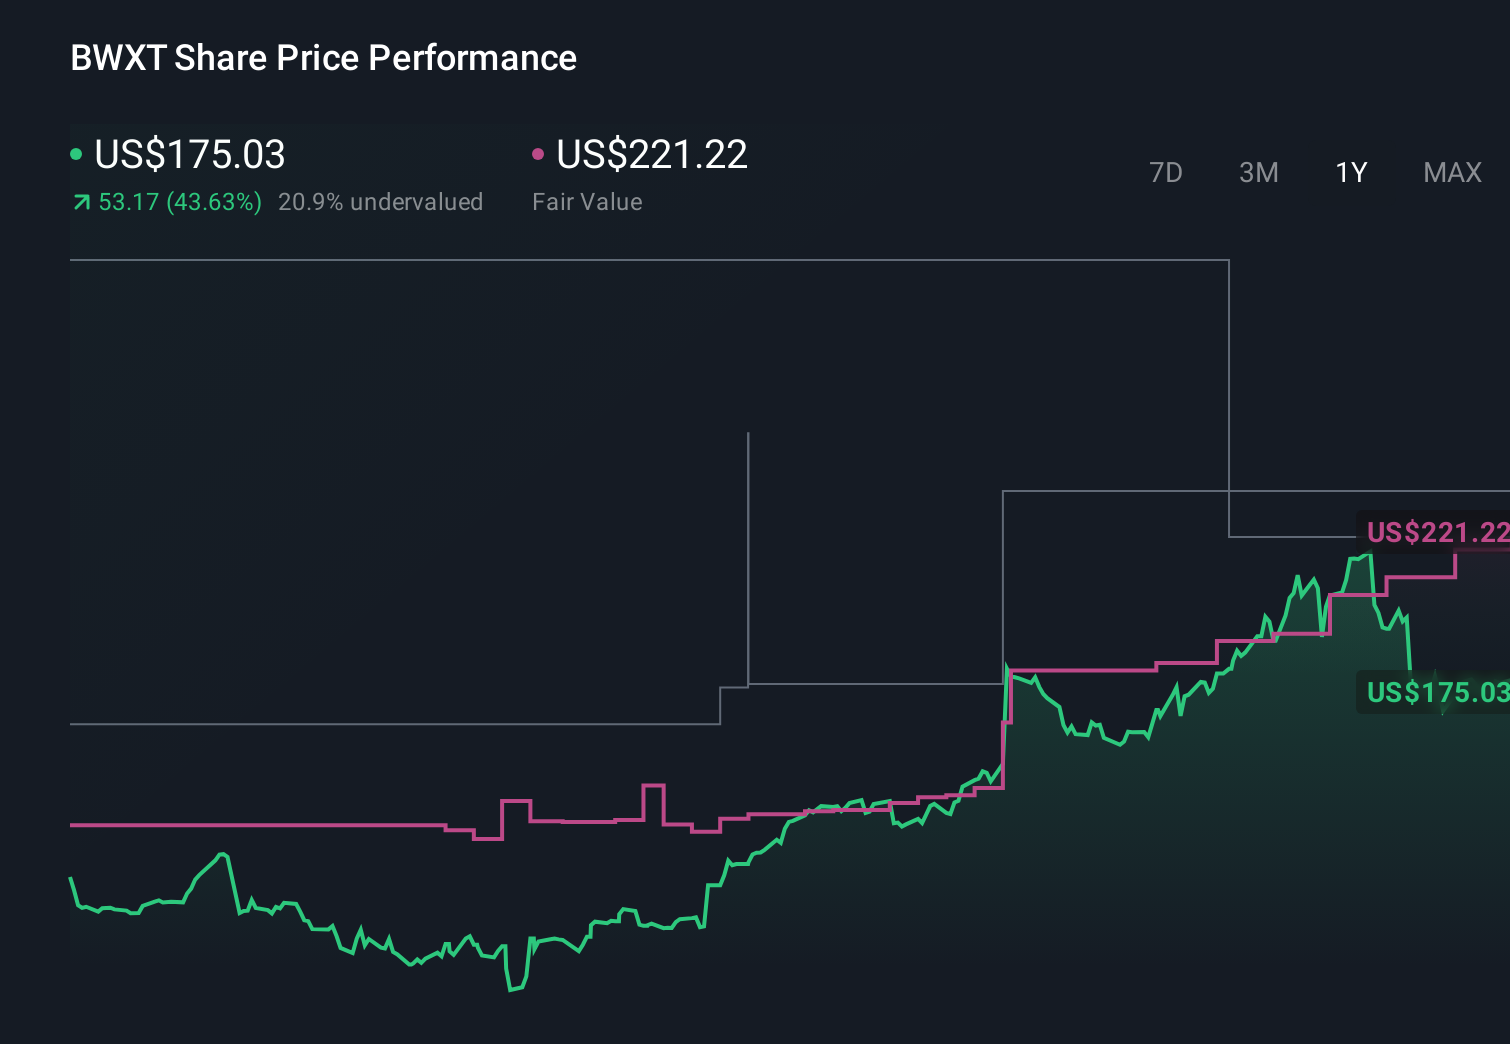
- The stock has seen firm share price moves recently, with returns of 10.8% over the past week, 12.1% over the past month, 10.8% year to date, 77.0% over one year, and 261.1% over three years. The five year return sits at 257.9%.
- Recent coverage of BWX Technologies has largely focused on its role in capital goods and defense related technology, which has kept investor attention on the stock. That context around its business mix is important when you think about how the market is currently pricing the shares.
- Even with this strong share price history, BWX Technologies currently scores 0/6 on our valuation checks, as shown in its valuation score. Next we will walk through the standard valuation approaches investors often use and then finish with a different way to think about what fair value could mean for you.
BWX Technologies scores just 0/6 on our valuation checks. See what other red flags we found in the full valuation breakdown.
Approach 1: BWX Technologies Discounted Cash Flow (DCF) Analysis
A Discounted Cash Flow, or DCF, model estimates what a business might be worth today by projecting its future cash flows and then discounting those back to a single present value.
For BWX Technologies, the model is a 2 Stage Free Cash Flow to Equity approach, using recent Free Cash Flow of about $448.2 million as a starting point. Analysts provide Free Cash Flow estimates for several years, and Simply Wall St then extends those projections. For example, projected Free Cash Flow for 2028 is $419.3 million, and the model also includes a full set of estimates out to 2035. All figures are expressed in dollars and then discounted to reflect the time value of money and risk.
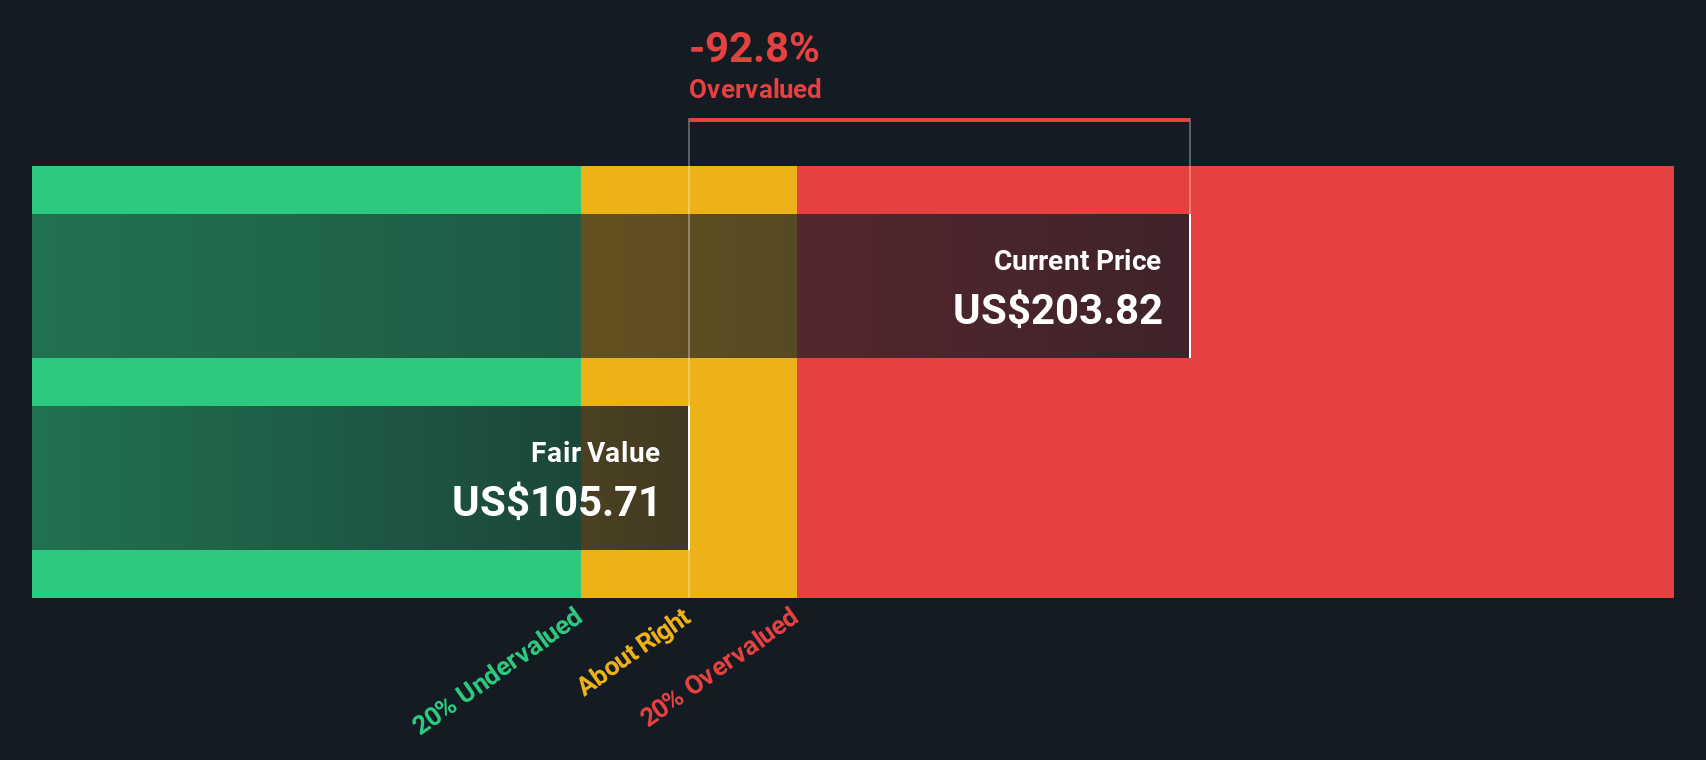
Bringing all of those discounted cash flows together, the DCF model arrives at an estimated intrinsic value of about $126.08 per share. Compared with the current share price of around US$201, the DCF output suggests the stock is about 59.8% above this intrinsic estimate, which indicates that BWX Technologies appears expensive on this specific cash flow view.
Result: OVERVALUED
Our Discounted Cash Flow (DCF) analysis suggests BWX Technologies may be overvalued by 59.8%. Discover 877 undervalued stocks or create your own screener to find better value opportunities.
Approach 2: BWX Technologies Price vs Earnings
For a profitable company like BWX Technologies, the P/E ratio is a useful shorthand for how much investors are currently paying for each dollar of earnings. It links directly to the bottom line, which is what ultimately matters for many shareholders.
What counts as a “normal” P/E depends on how the market views the company’s growth outlook and risk. Higher expected growth or lower perceived risk usually supports a higher P/E, while slower growth or higher risk often leads to a lower one.
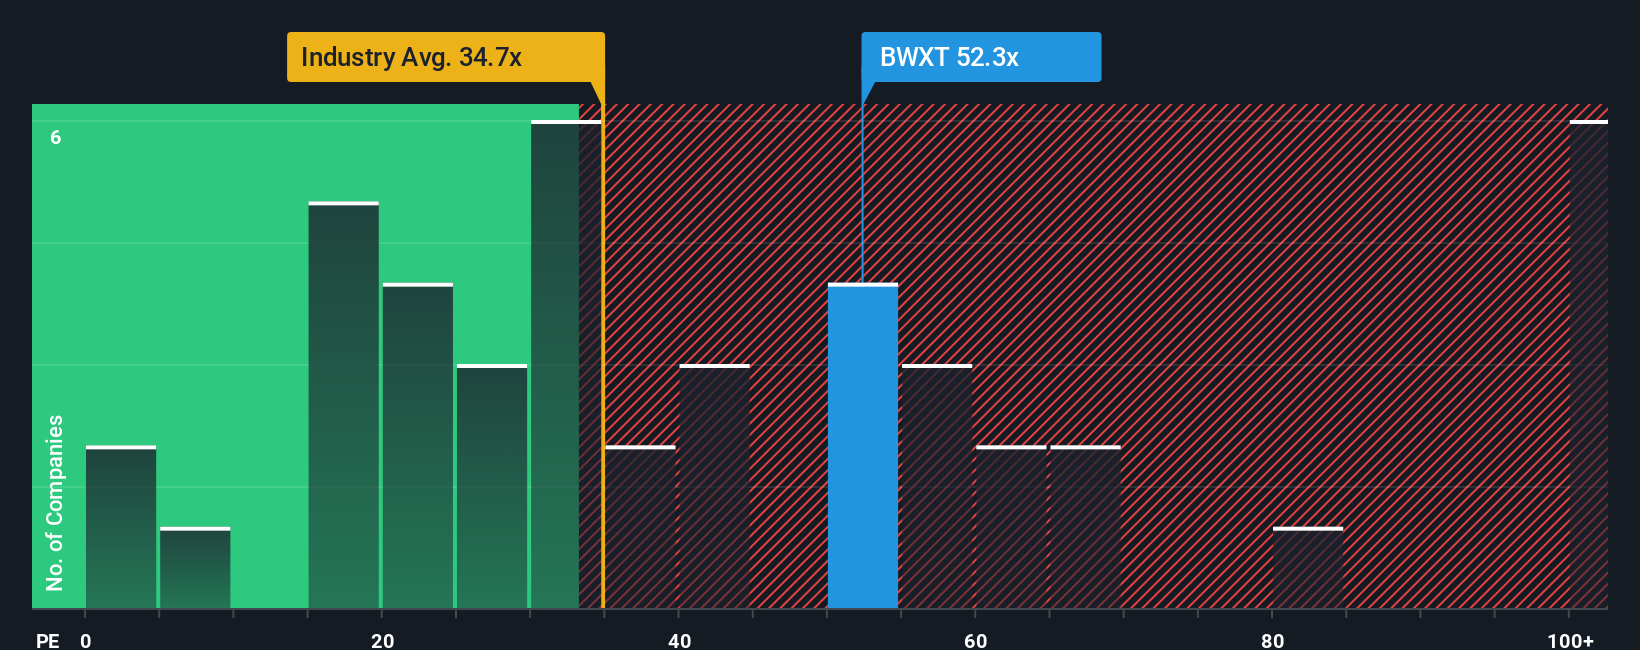
BWX Technologies is trading on a P/E of about 60.0x. That is above both the aerospace and defense industry average P/E of roughly 40.3x and the peer average of about 35.2x. Simply Wall St’s Fair Ratio for BWX Technologies is 30.4x, which is a proprietary estimate of what the P/E might be given factors such as earnings growth, profit margins, industry, market value and risk profile. This Fair Ratio goes further than a simple peer or industry comparison because it attempts to tailor the multiple to the company’s own characteristics rather than relying on broad group averages.
Since the current 60.0x P/E is well above the 30.4x Fair Ratio, BWX Technologies looks expensive on this earnings based view.
Result: OVERVALUED
P/E ratios tell one story, but what if the real opportunity lies elsewhere? Discover 1444 companies where insiders are betting big on explosive growth.
Upgrade Your Decision Making: Choose your BWX Technologies Narrative
Earlier we mentioned that there is an even better way to understand valuation, so let us introduce you to Narratives, which are simple stories you build around BWX Technologies that link your view of its business, your forecast for future revenue, earnings and margins, and your estimate of fair value. These stories are all contained within an easy tool on Simply Wall St’s Community page that updates automatically when new news or earnings arrive. The tool helps you compare your fair value to the current price to decide whether the stock looks attractive or stretched. For example, one investor might focus on BWX Technologies' role in small modular reactors, government contracts and acquisitions and decide the shares are worth around US$220. Another might focus more on contract risk, commercial volatility and regulatory uncertainty and land closer to US$120. Narratives let you see and compare those perspectives directly against today’s market price.
Do you think there's more to the story for BWX Technologies? Head over to our Community to see what others are saying!
This article by Simply Wall St is general in nature. We provide commentary based on historical data and analyst forecasts only using an unbiased methodology and our articles are not intended to be financial advice. It does not constitute a recommendation to buy or sell any stock, and does not take account of your objectives, or your financial situation. We aim to bring you long-term focused analysis driven by fundamental data. Note that our analysis may not factor in the latest price-sensitive company announcements or qualitative material. Simply Wall St has no position in any stocks mentioned.
Have feedback on this article? Concerned about the content? Get in touch with us directly. Alternatively, email editorial-team@simplywallst.com