
- LIVE QUOTES
- LEARN
- HELP
 Nasdaq
 Wall Street Journal
EN
Is It Too Late To Consider Trustmark (TRMK) After Five Year 52.6% Gain?
- If you are wondering whether Trustmark at around US$40.09 still offers value, you are not alone. This article walks through what the current price might be implying.
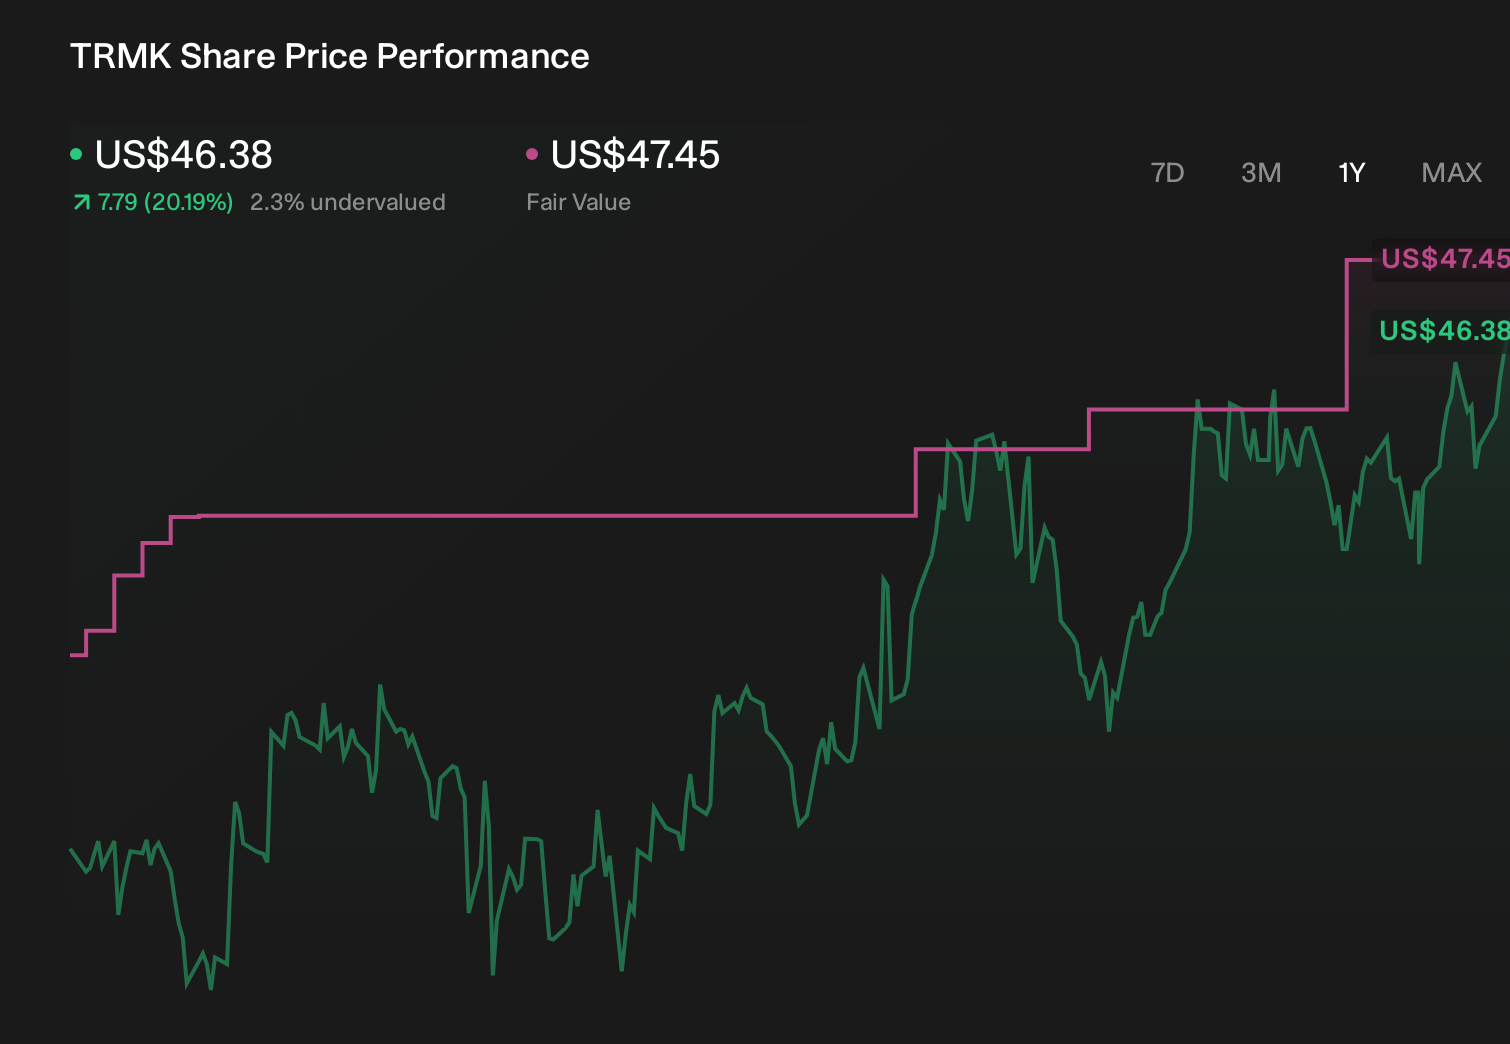
- The share price has moved 2.6% over the last week, has seen a 1.4% decline over the last month, and is up 23.9% over the past year and 52.6% over five years. This naturally raises questions about how much of the story is already reflected in the price.
- Recent attention on regional banks has kept investors focused on balance sheet quality, loan exposure, and capital strength, all of which feed into how Trustmark is being viewed right now. At the same time, sector wide discussions about interest rate paths and funding costs have shaped how investors think about banks that look either resilient or more exposed, which helps to explain some of the recent moves in Trustmark's shares.
- Trustmark currently scores 2 out of 6 on our valuation checks. We will walk through what different valuation methods say about that score, then finish with a way to look at valuation that pulls these approaches together more effectively.
Trustmark scores just 2/6 on our valuation checks. See what other red flags we found in the full valuation breakdown.
Approach 1: Trustmark Excess Returns Analysis
The Excess Returns model asks a simple question: after paying its cost of equity, how much value does Trustmark create for shareholders each year based on its earnings power and book value?
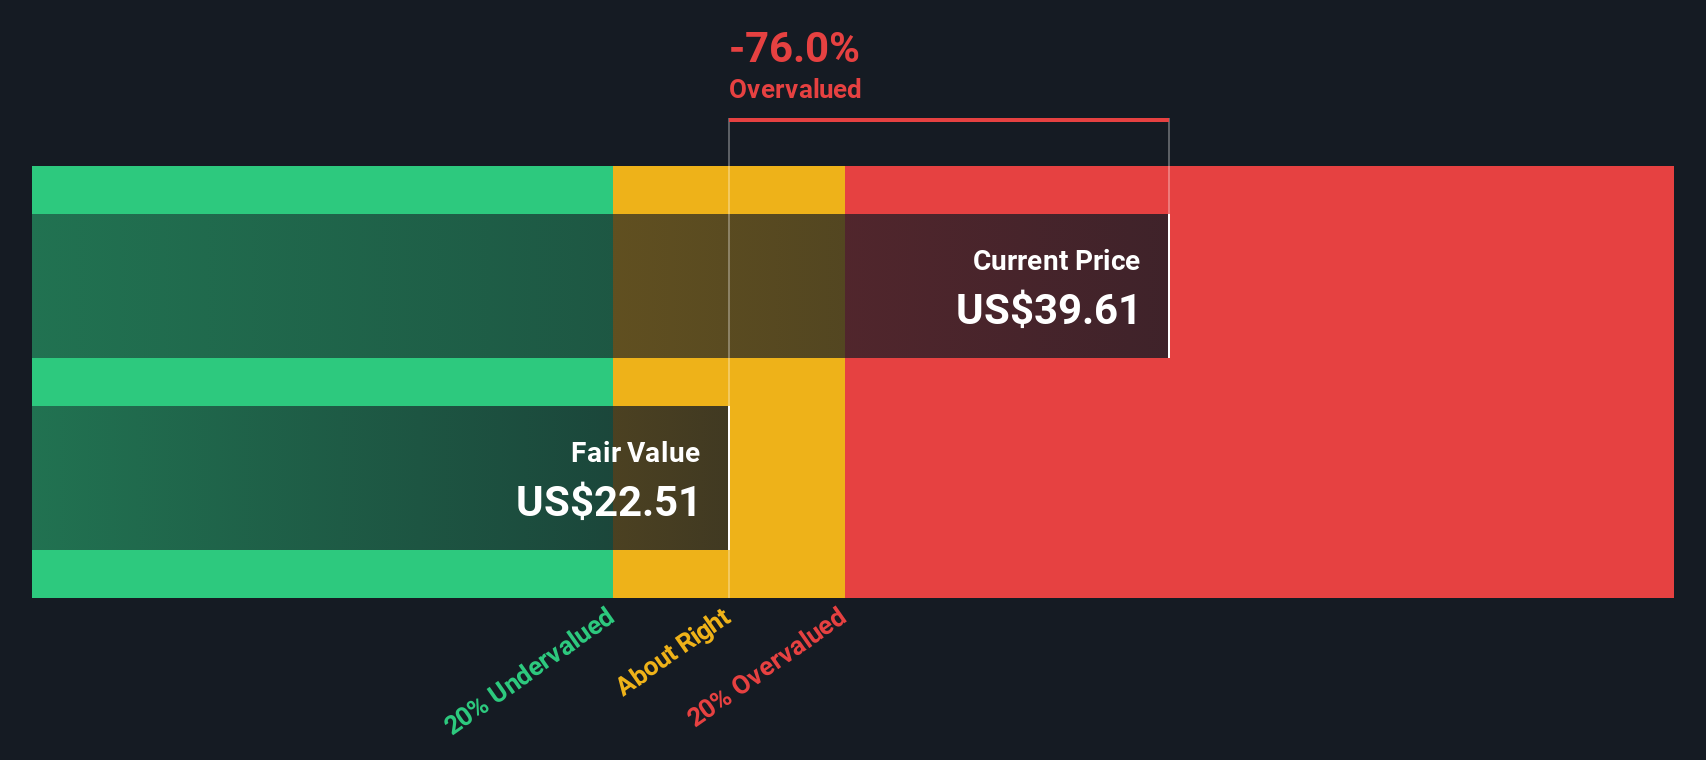
For Trustmark, book value is $35.16 per share and the model uses a stable earnings per share of $2.16, based on the median return on equity from the past 5 years. The cost of equity is set at $2.80 per share, which means the estimated excess return is a $0.64 loss per share. Put differently, the model assumes that, on this earnings profile, Trustmark falls short of covering its equity cost.
The average return on equity feeding into this view is 5.37%, and analysts’ weighted estimates point to a stable book value of $40.30 per share over time. Combining these assumptions, the Excess Returns model arrives at an intrinsic value of about $22.98 per share, implying the shares are 74.4% overvalued compared with the recent price around $40.09.
Result: OVERVALUED
Our Excess Returns analysis suggests Trustmark may be overvalued by 74.4%. Discover 877 undervalued stocks or create your own screener to find better value opportunities.
Approach 2: Trustmark Price vs Earnings
For profitable companies like Trustmark, the P/E ratio is a straightforward way to link what you pay today with the earnings the business is currently generating. It helps you see how many dollars the market is willing to pay for each dollar of earnings.
What counts as a “normal” or “fair” P/E usually reflects what investors think about a company’s future growth and the risk they see in its earnings stream. Higher expected growth or lower perceived risk can support a higher P/E, while slower growth or higher risk typically points to a lower one.
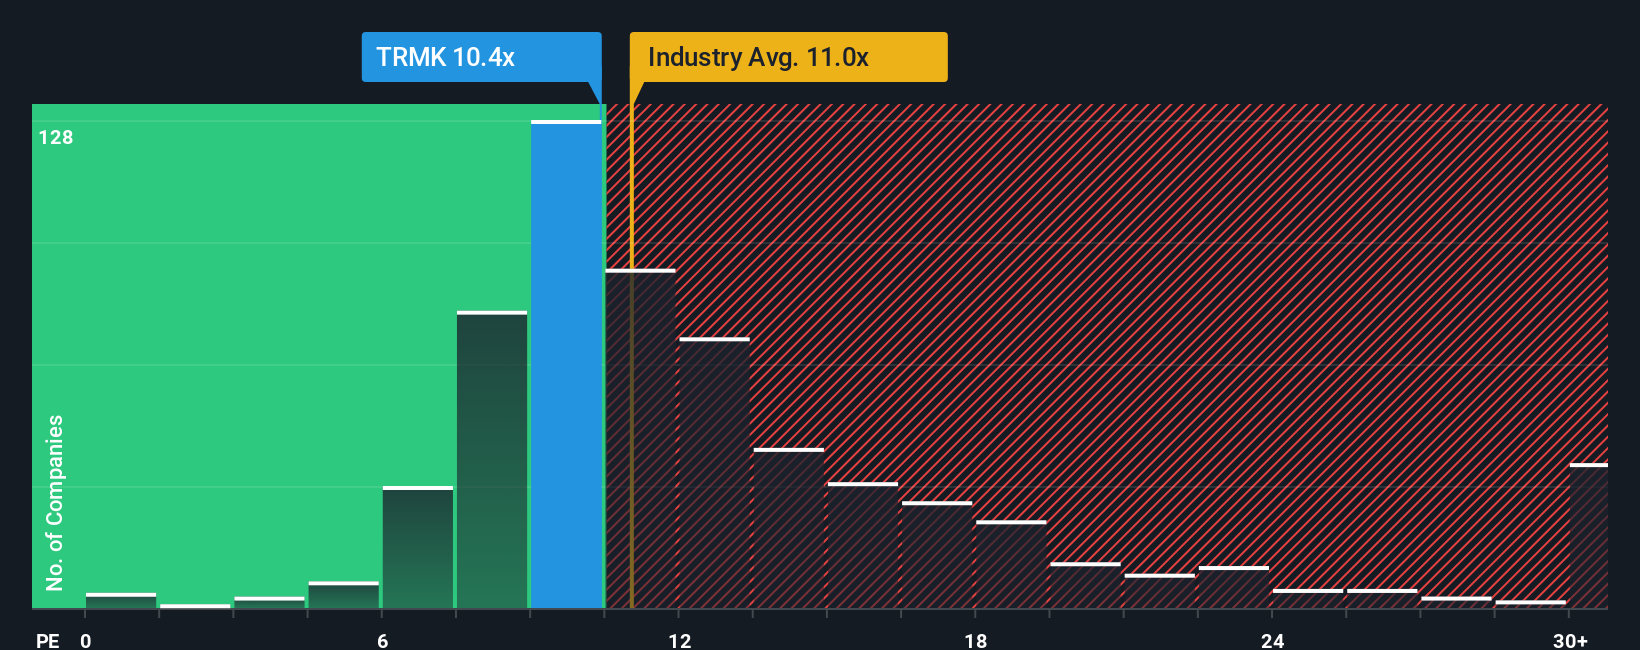
Trustmark currently trades on a P/E of 10.80x, compared with an industry average for Banks of 11.88x and a peer group average of 13.89x. Simply Wall St’s Fair Ratio for Trustmark is 10.78x. This Fair Ratio is a proprietary estimate of what P/E might make sense given Trustmark’s earnings profile, industry, profit margins, market value and key risks. It can be more tailored than a simple peer or industry comparison because it blends several company specific factors into one benchmark.
Since Trustmark’s actual P/E of 10.80x is very close to the Fair Ratio of 10.78x, the shares look priced at about the level this model would suggest.
Result: ABOUT RIGHT
P/E ratios tell one story, but what if the real opportunity lies elsewhere? Discover 1442 companies where insiders are betting big on explosive growth.
Upgrade Your Decision Making: Choose your Trustmark Narrative
Earlier we mentioned that there is an even better way to understand valuation. Let us introduce you to Narratives, a simple tool on Simply Wall St’s Community page that lets you write your own story for Trustmark by linking your view of its future revenue, earnings and margins to a forecast. This turns that into a Fair Value and then helps you compare that Fair Value with today’s price, so you can decide whether you see a potential opportunity or risk. The Narrative updates automatically as new news or earnings arrive. One investor might, for example, plug in the analyst consensus view that supports a Fair Value of US$43.60, while another, more cautious investor might plug in lower revenue, earnings or P/E assumptions that lead to a meaningfully lower Fair Value, all within the same easy framework.
Do you think there's more to the story for Trustmark? Head over to our Community to see what others are saying!
This article by Simply Wall St is general in nature. We provide commentary based on historical data and analyst forecasts only using an unbiased methodology and our articles are not intended to be financial advice. It does not constitute a recommendation to buy or sell any stock, and does not take account of your objectives, or your financial situation. We aim to bring you long-term focused analysis driven by fundamental data. Note that our analysis may not factor in the latest price-sensitive company announcements or qualitative material. Simply Wall St has no position in any stocks mentioned.
Have feedback on this article? Concerned about the content? Get in touch with us directly. Alternatively, email editorial-team@simplywallst.com