
- LIVE QUOTES
- LEARN
- HELP
 Nasdaq
 Wall Street Journal
EN
Douglas Elliman Inc.'s (NYSE:DOUG) high institutional ownership speaks for itself as stock continues to impress, up 11% over last week
Key Insights
- Institutions' substantial holdings in Douglas Elliman implies that they have significant influence over the company's share price
- The top 14 shareholders own 50% of the company
- Insider ownership in Douglas Elliman is 20%
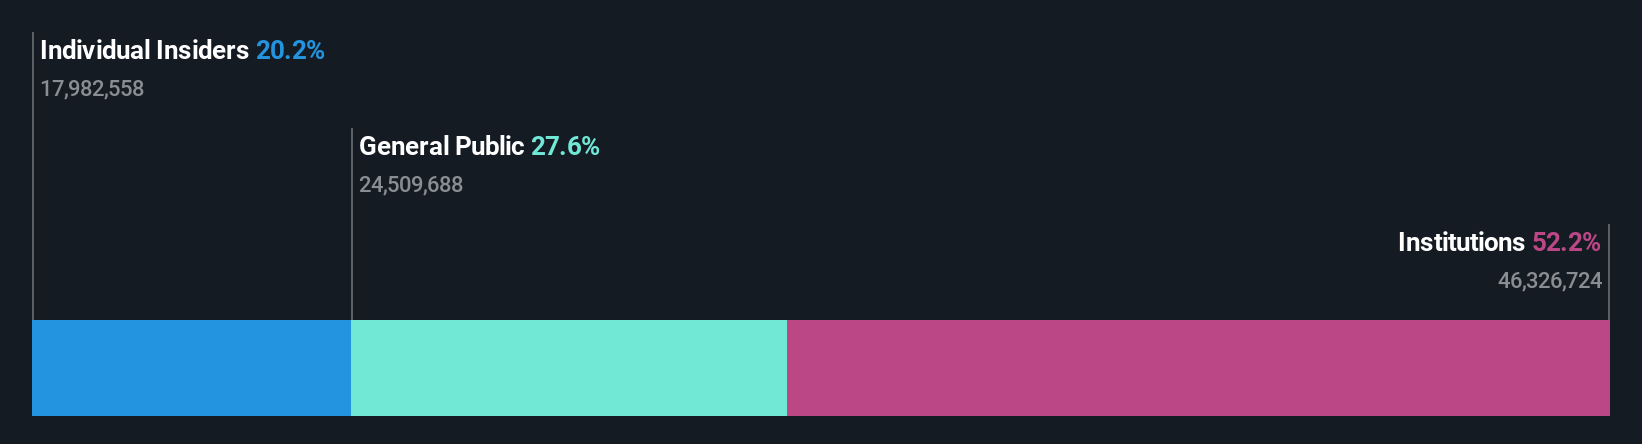
To get a sense of who is truly in control of Douglas Elliman Inc. (NYSE:DOUG), it is important to understand the ownership structure of the business. With 52% stake, institutions possess the maximum shares in the company. In other words, the group stands to gain the most (or lose the most) from their investment into the company.
And as as result, institutional investors reaped the most rewards after the company's stock price gained 11% last week. The gains from last week would have further boosted the one-year return to shareholders which currently stand at 61%.
Let's take a closer look to see what the different types of shareholders can tell us about Douglas Elliman.
View our latest analysis for Douglas Elliman
What Does The Institutional Ownership Tell Us About Douglas Elliman?
Institutions typically measure themselves against a benchmark when reporting to their own investors, so they often become more enthusiastic about a stock once it's included in a major index. We would expect most companies to have some institutions on the register, especially if they are growing.
We can see that Douglas Elliman does have institutional investors; and they hold a good portion of the company's stock. This can indicate that the company has a certain degree of credibility in the investment community. However, it is best to be wary of relying on the supposed validation that comes with institutional investors. They too, get it wrong sometimes. If multiple institutions change their view on a stock at the same time, you could see the share price drop fast. It's therefore worth looking at Douglas Elliman's earnings history below. Of course, the future is what really matters.

Investors should note that institutions actually own more than half the company, so they can collectively wield significant power. Douglas Elliman is not owned by hedge funds. Our data shows that Phillip Frost is the largest shareholder with 8.6% of shares outstanding. Meanwhile, the second and third largest shareholders, hold 5.6% and 4.7%, of the shares outstanding, respectively. Additionally, the company's CEO Michael Liebowitz directly holds 3.2% of the total shares outstanding.
After doing some more digging, we found that the top 14 have the combined ownership of 50% in the company, suggesting that no single shareholder has significant control over the company.
While it makes sense to study institutional ownership data for a company, it also makes sense to study analyst sentiments to know which way the wind is blowing. Our information suggests that there isn't any analyst coverage of the stock, so it is probably little known.
Insider Ownership Of Douglas Elliman
The definition of company insiders can be subjective and does vary between jurisdictions. Our data reflects individual insiders, capturing board members at the very least. Management ultimately answers to the board. However, it is not uncommon for managers to be executive board members, especially if they are a founder or the CEO.
Insider ownership is positive when it signals leadership are thinking like the true owners of the company. However, high insider ownership can also give immense power to a small group within the company. This can be negative in some circumstances.
Our information suggests that insiders maintain a significant holding in Douglas Elliman Inc.. Insiders have a US$44m stake in this US$219m business. We would say this shows alignment with shareholders, but it is worth noting that the company is still quite small; some insiders may have founded the business. You can click here to see if those insiders have been buying or selling.
General Public Ownership
The general public-- including retail investors -- own 28% stake in the company, and hence can't easily be ignored. While this size of ownership may not be enough to sway a policy decision in their favour, they can still make a collective impact on company policies.
Next Steps:
While it is well worth considering the different groups that own a company, there are other factors that are even more important. Case in point: We've spotted 1 warning sign for Douglas Elliman you should be aware of.
Of course this may not be the best stock to buy. So take a peek at this free free list of interesting companies.
NB: Figures in this article are calculated using data from the last twelve months, which refer to the 12-month period ending on the last date of the month the financial statement is dated. This may not be consistent with full year annual report figures.
Have feedback on this article? Concerned about the content? Get in touch with us directly. Alternatively, email editorial-team (at) simplywallst.com.
This article by Simply Wall St is general in nature. We provide commentary based on historical data and analyst forecasts only using an unbiased methodology and our articles are not intended to be financial advice. It does not constitute a recommendation to buy or sell any stock, and does not take account of your objectives, or your financial situation. We aim to bring you long-term focused analysis driven by fundamental data. Note that our analysis may not factor in the latest price-sensitive company announcements or qualitative material. Simply Wall St has no position in any stocks mentioned.