
- LIVE QUOTES
- LEARN
- HELP
 Nasdaq
 Wall Street Journal
EN
Is It Time To Reassess Himax Technologies (HIMX) After Recent Share Price Volatility
- If you are wondering whether Himax Technologies is reasonably priced or offering hidden value, you are not alone. This article focuses squarely on what the current share price might mean for long term investors.
- Himax shares last closed at US$8.28, with returns of 1.1% over 7 days, a 10.9% decline over 30 days, a 2.9% decline year to date, and gains of 9.4% over 1 year, 33.1% over 3 years, and 32.5% over 5 years that some investors may see as changing the balance between growth potential and risk.
- Recent attention on Himax has largely centered on how its share price performance lines up with broader interest in semiconductor names and changing expectations around demand cycles. This backdrop gives important context for thinking about whether the current price fairly reflects the company, or if the recent moves have gone too far in either direction.
- On our valuation checks Himax has a value score of 3 out of 6. Next we will walk through what traditional valuation methods say about that score, before finishing with a more holistic way to think about the company’s value.
Find out why Himax Technologies's 9.4% return over the last year is lagging behind its peers.
Approach 1: Himax Technologies Discounted Cash Flow (DCF) Analysis
A Discounted Cash Flow, or DCF, model projects a company’s future cash flows and then discounts them back to today’s dollars, aiming to estimate what the whole business might be worth right now.
For Himax Technologies, the model uses a 2 Stage Free Cash Flow to Equity approach based on cash flow projections. The latest twelve month free cash flow is about US$141.05 million. Analysts provide free cash flow estimates out to 2026, with Simply Wall St extrapolating further so that the 2035 free cash flow used in the model is US$35.55 million, all expressed in US$.
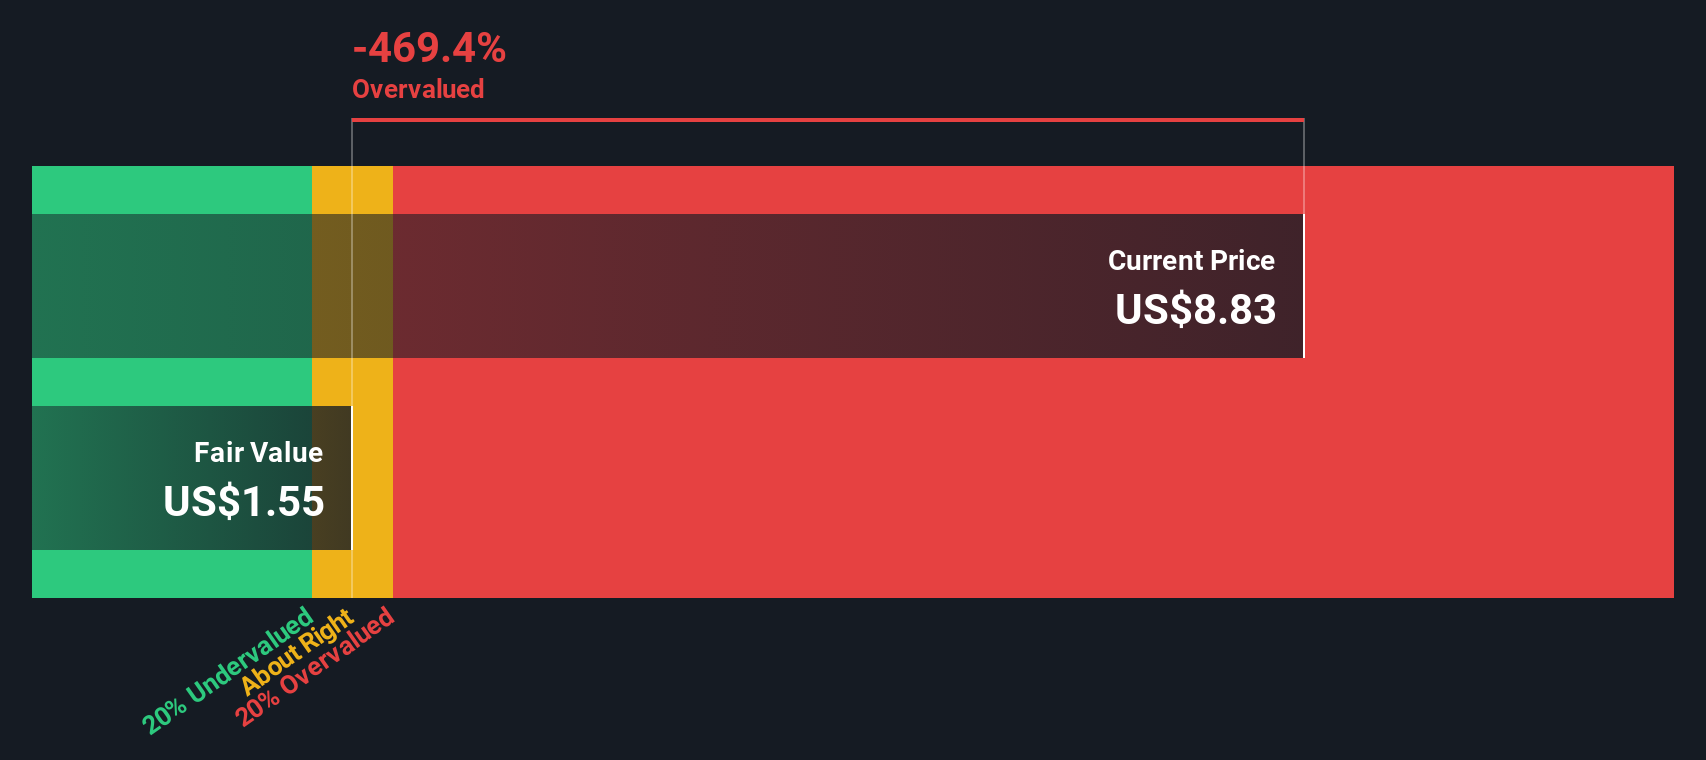
When these projected cash flows are discounted back to today, the model arrives at an estimated intrinsic value of around US$1.88 per share. Compared with the recent share price of US$8.28, this implies the stock is very richly priced, with the DCF suggesting it is 341.4% overvalued.
Result: OVERVALUED
Our Discounted Cash Flow (DCF) analysis suggests Himax Technologies may be overvalued by 341.4%. Discover 883 undervalued stocks or create your own screener to find better value opportunities.
Approach 2: Himax Technologies Price vs Earnings
For profitable companies, the P/E ratio is a straightforward way to link what you pay for each share to the earnings that support it. It helps you see how many dollars investors are currently willing to pay for every dollar of earnings.
What counts as a “normal” P/E depends on how the market views a company’s growth potential and risk profile. Higher expected growth or lower perceived risk can support a higher multiple, while slower expected growth or higher risk tends to be associated with a lower one.
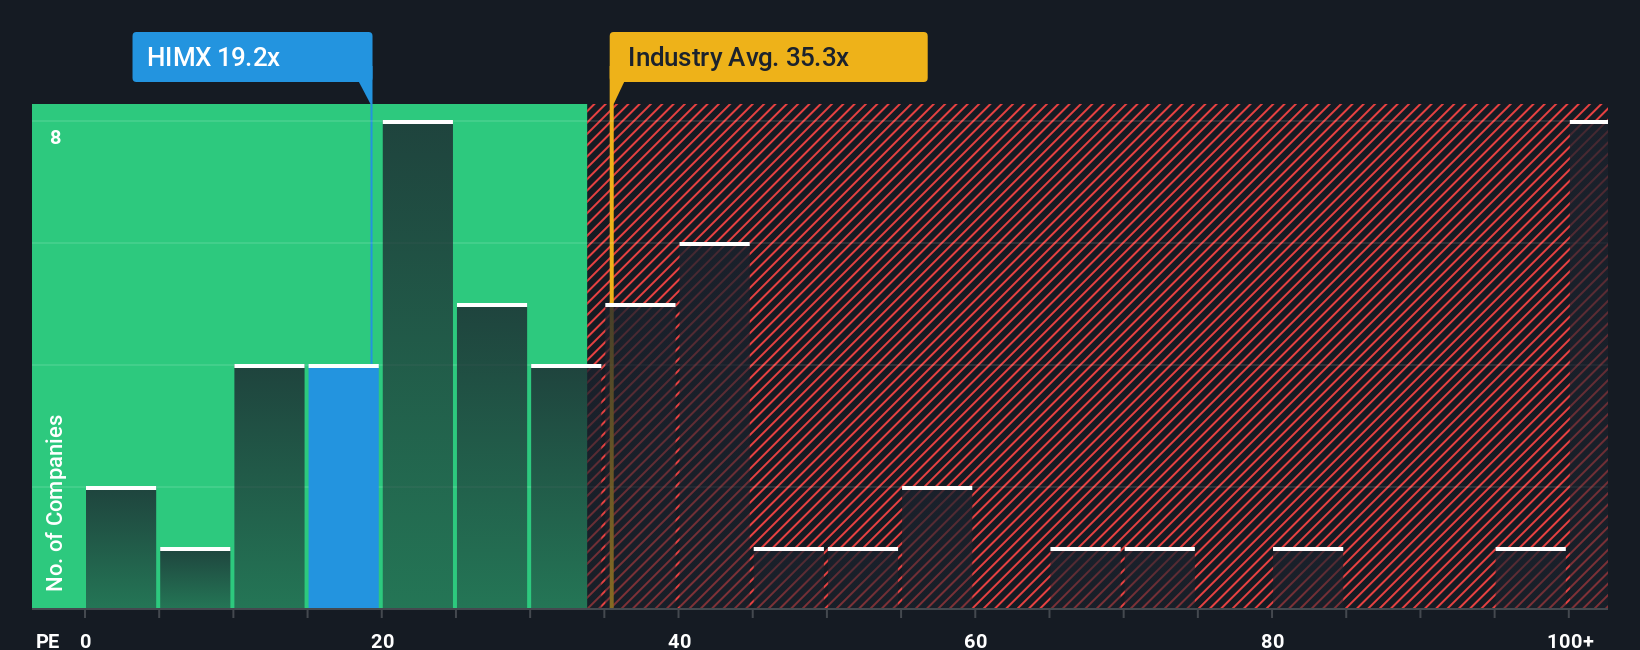
Himax Technologies currently trades on a P/E of 23.28x. That is below both the Semiconductor industry average of about 42.34x and a broader peer group average of 83.33x. Simply Wall St also provides a proprietary “Fair Ratio” of 41.71x, which reflects what its P/E might be based on factors like earnings growth, industry, profit margin, market cap and specific risks. This Fair Ratio can offer a more tailored reference point than simple comparisons with industry or peer averages, because it aims to weigh multiple company specific drivers at once.
Comparing the current P/E of 23.28x with the Fair Ratio of 41.71x indicates that Himax shares are trading below that tailored reference level.
Result: UNDERVALUED
P/E ratios tell one story, but what if the real opportunity lies elsewhere? Discover 1446 companies where insiders are betting big on explosive growth.
Upgrade Your Decision Making: Choose your Himax Technologies Narrative
Earlier we mentioned that there is an even better way to understand valuation, so let us introduce you to Narratives, which are simply your own story about Himax Technologies, linked directly to your assumptions for future revenue, earnings, margins and a fair value that you can compare with today’s price.
On Simply Wall St’s Community page, Narratives let you turn that story into a simple forecast and fair value estimate. They then show you at a glance whether your view suggests Himax is priced above or below what you think it is worth, helping you decide if it might be a time to buy, hold, or sell based on your own numbers.
Because Narratives on the platform update automatically when new information such as earnings, guidance or news is added, your fair value view stays connected to the latest facts without you needing to rebuild your whole thesis each time.
For Himax, for example, one investor might build a Narrative close to the analysts’ consensus fair value of about US$8.54 with revenue growth of roughly 8.37%, a net profit margin near 13.85% and a future P/E of about 5.68x. Another might lean toward the higher or lower analyst targets of US$11.60 or US$7.00 based on how they weigh opportunities in AI sensing, optics and automotive display ICs against risks such as trade tensions, demand volatility and competition.
Do you think there's more to the story for Himax Technologies? Head over to our Community to see what others are saying!

This article by Simply Wall St is general in nature. We provide commentary based on historical data and analyst forecasts only using an unbiased methodology and our articles are not intended to be financial advice. It does not constitute a recommendation to buy or sell any stock, and does not take account of your objectives, or your financial situation. We aim to bring you long-term focused analysis driven by fundamental data. Note that our analysis may not factor in the latest price-sensitive company announcements or qualitative material. Simply Wall St has no position in any stocks mentioned.
Have feedback on this article? Concerned about the content? Get in touch with us directly. Alternatively, email editorial-team@simplywallst.com