
- LIVE QUOTES
- LEARN
- HELP
 Nasdaq
 Wall Street Journal
EN
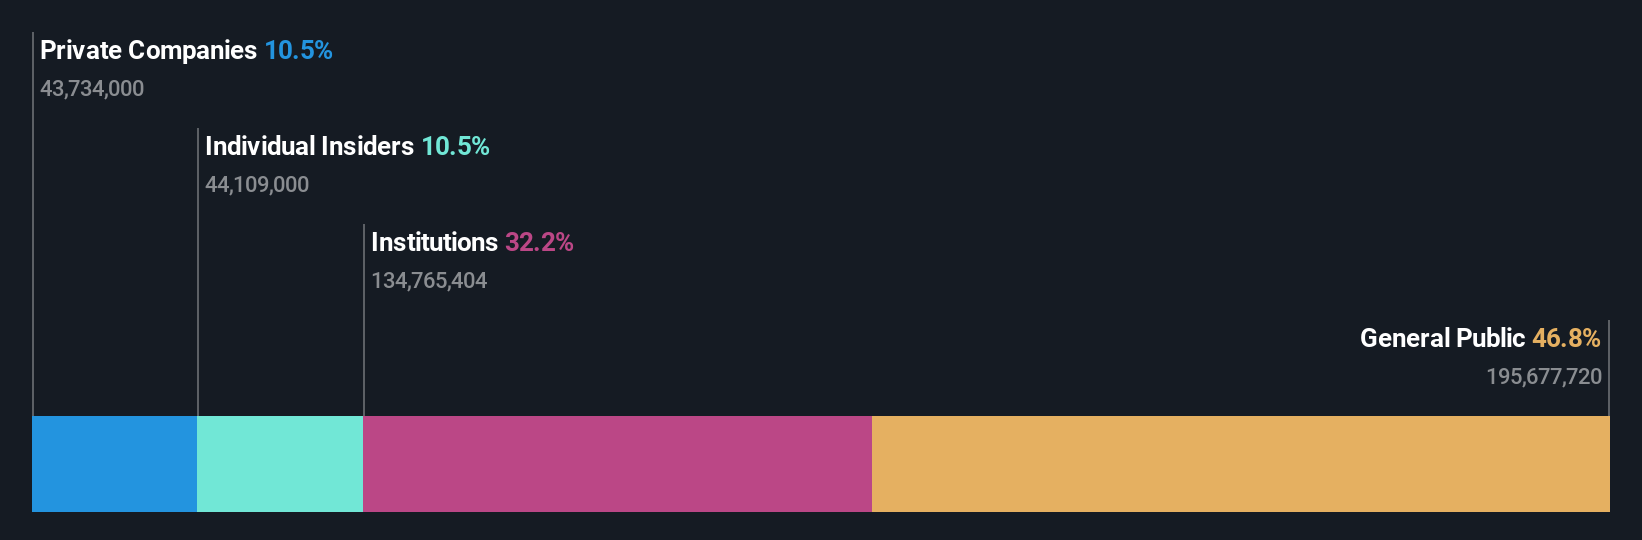
While institutions own 32% of Capcom Co., Ltd. (TSE:9697), individual investors are its largest shareholders with 47% ownership
Key Insights
- Significant control over Capcom by individual investors implies that the general public has more power to influence management and governance-related decisions
- The top 25 shareholders own 48% of the company
- Insiders own 11% of Capcom
A look at the shareholders of Capcom Co., Ltd. (TSE:9697) can tell us which group is most powerful. And the group that holds the biggest piece of the pie are individual investors with 47% ownership. That is, the group stands to benefit the most if the stock rises (or lose the most if there is a downturn).
And institutions on the other hand have a 32% ownership in the company. Generally speaking, as a company grows, institutions will increase their ownership. Conversely, insiders often decrease their ownership over time.
Let's take a closer look to see what the different types of shareholders can tell us about Capcom.
See our latest analysis for Capcom
What Does The Institutional Ownership Tell Us About Capcom?
Institutional investors commonly compare their own returns to the returns of a commonly followed index. So they generally do consider buying larger companies that are included in the relevant benchmark index.
Capcom already has institutions on the share registry. Indeed, they own a respectable stake in the company. This implies the analysts working for those institutions have looked at the stock and they like it. But just like anyone else, they could be wrong. When multiple institutions own a stock, there's always a risk that they are in a 'crowded trade'. When such a trade goes wrong, multiple parties may compete to sell stock fast. This risk is higher in a company without a history of growth. You can see Capcom's historic earnings and revenue below, but keep in mind there's always more to the story.

Capcom is not owned by hedge funds. Looking at our data, we can see that the largest shareholder is Crossroad Limited with 10% of shares outstanding. Yoshiyuki Tsujimoto is the second largest shareholder owning 3.8% of common stock, and The Vanguard Group, Inc. holds about 3.6% of the company stock. In addition, we found that Kenzo Tsujimoto, the CEO has 1.9% of the shares allocated to their name.
A deeper look at our ownership data shows that the top 25 shareholders collectively hold less than half of the register, suggesting a large group of small holders where no single shareholder has a majority.
While studying institutional ownership for a company can add value to your research, it is also a good practice to research analyst recommendations to get a deeper understand of a stock's expected performance. There are plenty of analysts covering the stock, so it might be worth seeing what they are forecasting, too.
Insider Ownership Of Capcom
While the precise definition of an insider can be subjective, almost everyone considers board members to be insiders. The company management answer to the board and the latter should represent the interests of shareholders. Notably, sometimes top-level managers are on the board themselves.
Most consider insider ownership a positive because it can indicate the board is well aligned with other shareholders. However, on some occasions too much power is concentrated within this group.
Our most recent data indicates that insiders own a reasonable proportion of Capcom Co., Ltd.. Insiders own JP¥159b worth of shares in the JP¥1.5t company. That's quite meaningful. Most would say this shows a good degree of alignment with shareholders, especially in a company of this size. You can click here to see if those insiders have been buying or selling.
General Public Ownership
The general public, who are usually individual investors, hold a 47% stake in Capcom. While this group can't necessarily call the shots, it can certainly have a real influence on how the company is run.
Private Company Ownership
We can see that Private Companies own 10%, of the shares on issue. It's hard to draw any conclusions from this fact alone, so its worth looking into who owns those private companies. Sometimes insiders or other related parties have an interest in shares in a public company through a separate private company.
Next Steps:
While it is well worth considering the different groups that own a company, there are other factors that are even more important.
Many find it useful to take an in depth look at how a company has performed in the past. You can access this detailed graph of past earnings, revenue and cash flow.
If you are like me, you may want to think about whether this company will grow or shrink. Luckily, you can check this free report showing analyst forecasts for its future.
NB: Figures in this article are calculated using data from the last twelve months, which refer to the 12-month period ending on the last date of the month the financial statement is dated. This may not be consistent with full year annual report figures.
Have feedback on this article? Concerned about the content? Get in touch with us directly. Alternatively, email editorial-team (at) simplywallst.com.
This article by Simply Wall St is general in nature. We provide commentary based on historical data and analyst forecasts only using an unbiased methodology and our articles are not intended to be financial advice. It does not constitute a recommendation to buy or sell any stock, and does not take account of your objectives, or your financial situation. We aim to bring you long-term focused analysis driven by fundamental data. Note that our analysis may not factor in the latest price-sensitive company announcements or qualitative material. Simply Wall St has no position in any stocks mentioned.