
- LIVE QUOTES
- LEARN
- HELP
 Nasdaq
 Wall Street Journal
EN
Assessing Realty Income (O) Valuation As Dividend Growth Expectations Shift
Why Realty Income is on investors’ radar today
Realty Income, an S&P 500 real estate company known for its monthly dividend track record, is drawing fresh attention as investors reassess its income profile and current valuation in light of recent share performance.
See our latest analysis for Realty Income.
At a share price of US$57.35, Realty Income has seen mixed momentum recently, with a 7 day share price return of 1.74% but a 90 day share price return decline of 2.23%. Its 1 year total shareholder return of 15.54% and 5 year total shareholder return of 31.85% indicate more supportive longer term sentiment around income and reinvested dividends.
If this kind of steady income story appeals to you, it can also be worth widening the net to other real asset names via fast growing stocks with high insider ownership.
With Realty Income trading at US$57.35, and indicators such as an intrinsic discount figure and a gap to analyst targets on the table, is the current price a genuine entry point, or is the market already banking on future growth?
Most Popular Narrative: 6.4% Undervalued
Compared with the last close of US$57.35, the narrative fair value of US$61.26 suggests a modest discount that income focused investors may want to understand more clearly.
Given the expectation that Realty Income’s dividend growth will decelerate in the coming years, greater weight will be assigned to the Dividend Discount Model. This model reflects more appropriately the anticipated slowdown in dividend growth. In contrast, the Historical Yield method assumes mean reversion, which introduces a higher degree of uncertainty, and so it will have a lower weight on the valuation.
Curious how a stable dividend stream still leads to an above market fair value estimate? The narrative blends long term payout growth and income focused return hurdles in a way that might challenge your assumptions about what justifies today’s price.
Result: Fair Value of $61.26 (UNDERVALUED)
Have a read of the narrative in full and understand what's behind the forecasts.
However, you still need to keep an eye on slower dividend growth assumptions and any shift in required returns, which could compress the implied fair value.
Find out about the key risks to this Realty Income narrative.
Another View: Earnings Multiple Sends A Different Signal
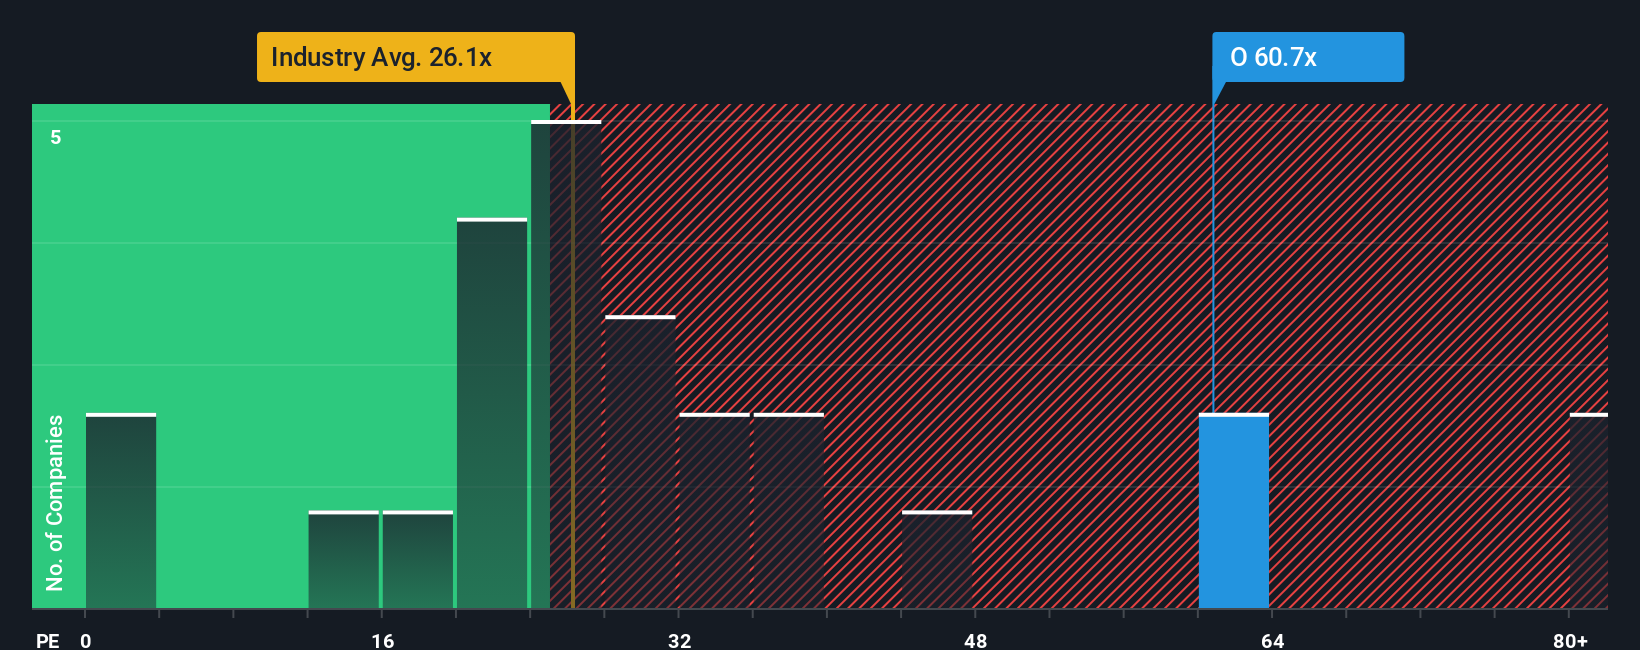
The user narrative leans on dividends and points to a fair value of US$61.26, but the earnings multiple tells a tougher story. Realty Income trades on a P/E of 54.8x, compared with 31.7x for peers, 27.4x for the US Retail REITs industry, and a fair ratio of 34.9x.
That gap suggests the market is paying a premium for each dollar of earnings, which could limit upside if sentiment cools or earnings do not keep pace. This raises a question: is this a case of income strength justifying a rich tag, or is it a valuation stretch you may want to think carefully about?
See what the numbers say about this price — find out in our valuation breakdown.
Build Your Own Realty Income Narrative
If you look at these numbers and reach a different conclusion, or simply want to test your own view, you can build a tailored narrative in just a few minutes with Do it your way.
A great starting point for your Realty Income research is our analysis highlighting 4 key rewards and 2 important warning signs that could impact your investment decision.
Looking for more investment ideas?
If Realty Income has you thinking more broadly about income and growth, do not stop here. Use screeners to uncover other stocks that could fit your plan.
- Target potential value by scanning these 883 undervalued stocks based on cash flows that may offer prices below what their cash flows suggest.
- Spot fresh themes in digital assets by reviewing these 79 cryptocurrency and blockchain stocks tied to blockchain, payments, and related infrastructure.
- Strengthen your passive income focus by checking these 12 dividend stocks with yields > 3% that offer yields above 3%.
This article by Simply Wall St is general in nature. We provide commentary based on historical data and analyst forecasts only using an unbiased methodology and our articles are not intended to be financial advice. It does not constitute a recommendation to buy or sell any stock, and does not take account of your objectives, or your financial situation. We aim to bring you long-term focused analysis driven by fundamental data. Note that our analysis may not factor in the latest price-sensitive company announcements or qualitative material. Simply Wall St has no position in any stocks mentioned.
Have feedback on this article? Concerned about the content? Get in touch with us directly. Alternatively, email editorial-team@simplywallst.com