
- LIVE QUOTES
- LEARN
- HELP
 Nasdaq
 Wall Street Journal
EN
Is Alexandria Real Estate Equities NYSE ARE Still Priced Below Its Long Term Potential
- If you are looking at Alexandria Real Estate Equities and wondering whether the current share price still reflects its underlying worth, you are not alone.
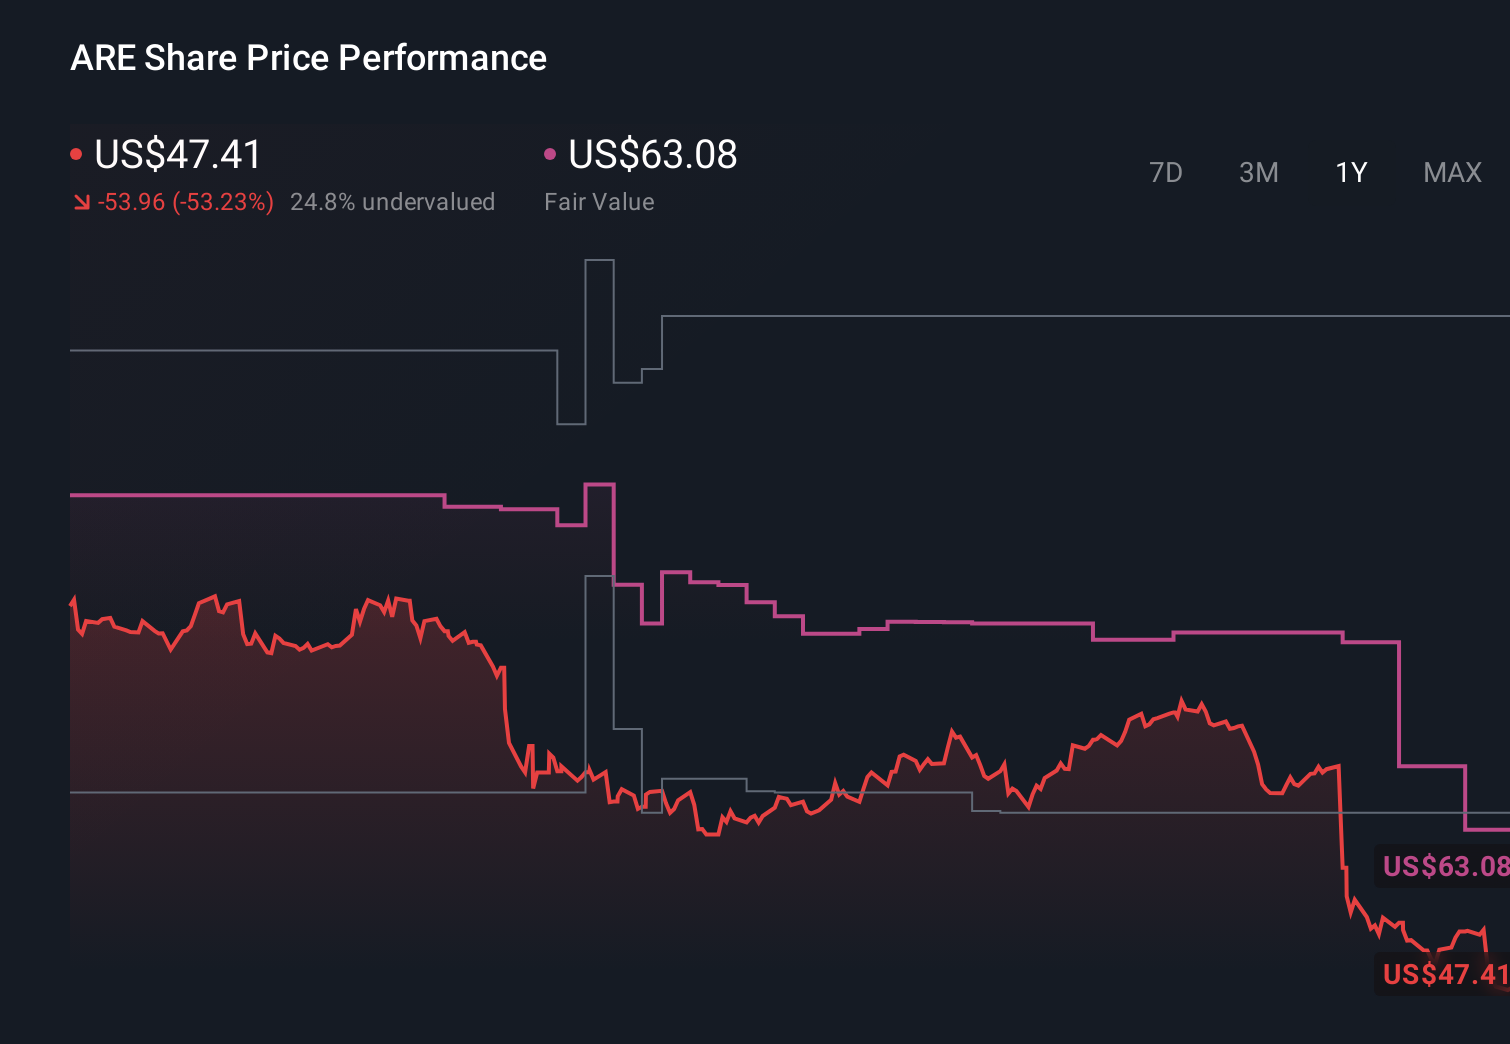
- The stock trades at US$52.18, with returns of 6.6% over the last week and 16.0% over the last month, set against a 6.6% return year to date and a 43.0% decline over the past year, as well as 60.5% and 62.0% declines over the last 3 and 5 years.
- Recent moves in the share price have come against a backdrop of ongoing attention on listed real estate companies and how investors are thinking about their long term income potential and balance sheet strength. This context is important when you assess whether Alexandria Real Estate Equities' current valuation still lines up with what you are paying today.
- On Simply Wall St's 6 point valuation checklist, Alexandria Real Estate Equities scores 5 out of 6. We will break this down through different valuation approaches next, before finishing with a broader way to think about what valuation really means for you as a shareholder.
Approach 1: Alexandria Real Estate Equities Discounted Cash Flow (DCF) Analysis
A DCF model takes Alexandria Real Estate Equities' adjusted funds from operations, projects those cash flows into the future, then discounts them back to today to estimate what the business could be worth now.
The latest twelve month free cash flow is reported at $1.63b. Analysts provide detailed forecasts for the next few years, and Simply Wall St extends those with its own estimates to build a 10 year view. For example, projected free cash flow is $837.08m in 2026 and $913.05m in 2028, with further extrapolated figures reaching about $1.17b by 2035. All of these future cash flows are discounted using a 2 stage Free Cash Flow to Equity model based on adjusted funds from operations.
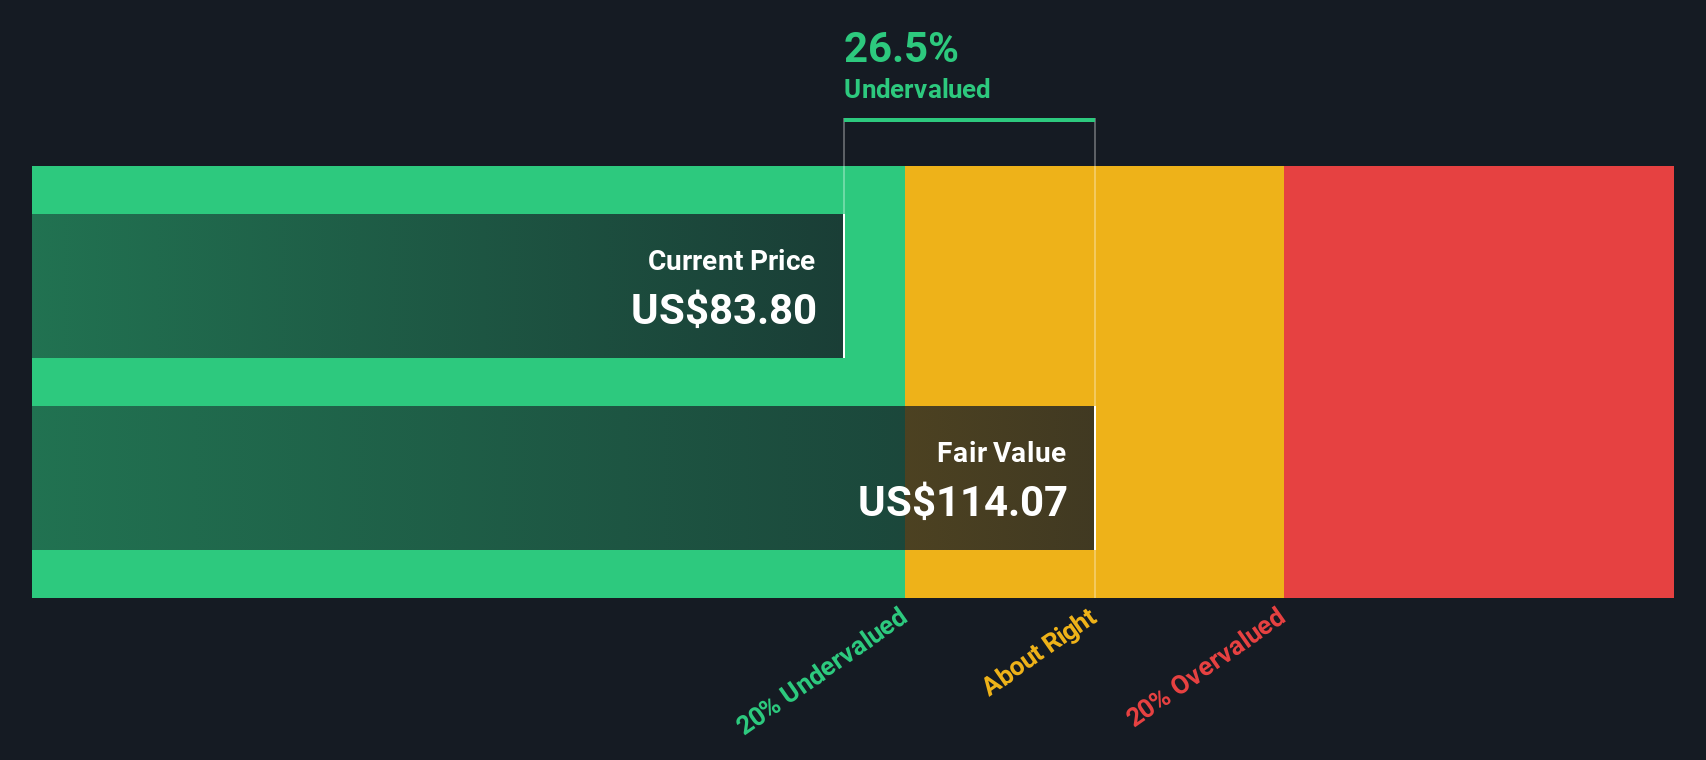
On this basis, the estimated intrinsic value comes out at $80.35 per share, compared with the current share price of $52.18. That implies the shares trade at roughly a 35.1% discount to this DCF estimate, which suggests the market price is below the modelled value of the underlying cash flows.
Result: UNDERVALUED
Our Discounted Cash Flow (DCF) analysis suggests Alexandria Real Estate Equities is undervalued by 35.1%. Track this in your watchlist or portfolio, or discover 882 more undervalued stocks based on cash flows.
Approach 2: Alexandria Real Estate Equities Price vs Sales
The preferred multiple here is the P/S ratio, which can be a useful way to compare profitable companies because it relates the value of the equity directly to the revenue the business is generating, regardless of short term swings in earnings.
In general, the level of an appropriate P/S ratio is influenced by what investors expect for future growth and how much risk they see in those cash flows. Higher expected growth and lower perceived risk usually support a higher multiple, while slower growth or higher uncertainty tend to support a lower one.
Alexandria Real Estate Equities currently trades on a P/S ratio of 2.95x. This sits below both the Health Care REITs industry average of 6.56x and the peer average of 5.91x. Simply Wall St also calculates a proprietary "Fair Ratio" of 3.91x, which represents the P/S multiple that might be expected given factors such as earnings growth, profit margins, industry, market cap and company specific risks.
This Fair Ratio can be more informative than a simple comparison with industry or peers because it attempts to tailor the multiple to Alexandria Real Estate Equities' own characteristics. Comparing the Fair Ratio of 3.91x with the current P/S of 2.95x suggests the shares are trading below this model based reference point.
Result: UNDERVALUED

P/S ratios tell one story, but what if the real opportunity lies elsewhere? Discover 1444 companies where insiders are betting big on explosive growth.
Upgrade Your Decision Making: Choose your Alexandria Real Estate Equities Narrative
Earlier we mentioned that there is an even better way to understand valuation. On Simply Wall St's Community page you can use Narratives, which let you set out your own story for Alexandria Real Estate Equities by linking your expectations for future revenue, earnings and margins to a forecast. You can then compare the Fair Value that results from that forecast with the current price to help you decide when you might want to buy or sell, and see that view update automatically as new news or earnings arrive. One investor might build a more optimistic narrative closer to the US$144 target, while another might anchor on the more cautious US$71 view, even though both are using the same easy tool and the same latest data.
Do you think there's more to the story for Alexandria Real Estate Equities? Head over to our Community to see what others are saying!
This article by Simply Wall St is general in nature. We provide commentary based on historical data and analyst forecasts only using an unbiased methodology and our articles are not intended to be financial advice. It does not constitute a recommendation to buy or sell any stock, and does not take account of your objectives, or your financial situation. We aim to bring you long-term focused analysis driven by fundamental data. Note that our analysis may not factor in the latest price-sensitive company announcements or qualitative material. Simply Wall St has no position in any stocks mentioned.
Have feedback on this article? Concerned about the content? Get in touch with us directly. Alternatively, email editorial-team@simplywallst.com