
- LIVE QUOTES
- LEARN
- HELP
 Nasdaq
 Wall Street Journal
EN
Assessing Monte Rosa Therapeutics (GLUE) Valuation After Its Strong 1 Year Share Price Momentum
Why Monte Rosa Therapeutics Is Drawing Investor Attention
Monte Rosa Therapeutics (GLUE) has been on investors’ radar after recent trading performance, with the stock showing strong returns over the past month and past 3 months. This has prompted fresh questions about how the current price reflects fundamentals.
See our latest analysis for Monte Rosa Therapeutics.
Beyond the recent spike, Monte Rosa Therapeutics has seen a 131.87% 90 day share price return and a very large 288.65% 1 year total shareholder return, which indicates notable momentum building around the story and the perceived balance of risk and reward.
If this kind of move has you looking at the wider biotech space, it could be a good moment to scan other healthcare stocks that are catching investors’ attention.
With Monte Rosa showing a very large 1 year total return, a value score of 2 and an estimated 38% intrinsic discount, the key question now is whether there is still a buying opportunity or if the market is already pricing in future growth.
Price-to-Earnings of 72.4x: Is it justified?
On a P/E basis, Monte Rosa Therapeutics looks expensive, with a 72.4x multiple at the last close of $23.28 compared with peers and modelled fair levels.
The P/E ratio tells you how much investors are paying today for each dollar of earnings, which is a common reference point for profitable biotech names. A higher multiple can reflect confidence that current profitability will be sustained or improved, even when near term earnings forecasts are not pointing in that direction.
For Monte Rosa, the current 72.4x P/E sits well above the estimated fair P/E of 12.3x. That gap suggests the market is paying a much richer price for earnings than the level our modelling indicates could be justified over time. It is also well ahead of the average multiples seen in the broader peer set.
Relative to the US Biotechs industry average P/E of 22x and the peer average of 21.6x, Monte Rosa trades on a substantially higher earnings multiple. This very wide premium implies investors are assigning a meaningfully stronger outlook to the company than to the typical biotech, even though other indicators point to more moderate expectations for revenue and earnings over the coming years.
Explore the SWS fair ratio for Monte Rosa Therapeutics
Result: Price-to-Earnings of 72.4x (OVERVALUED)
However, recent annual revenue and net income growth are both in decline, and any setback in clinical programs or the Roche collaboration could quickly challenge the current optimism.
Find out about the key risks to this Monte Rosa Therapeutics narrative.
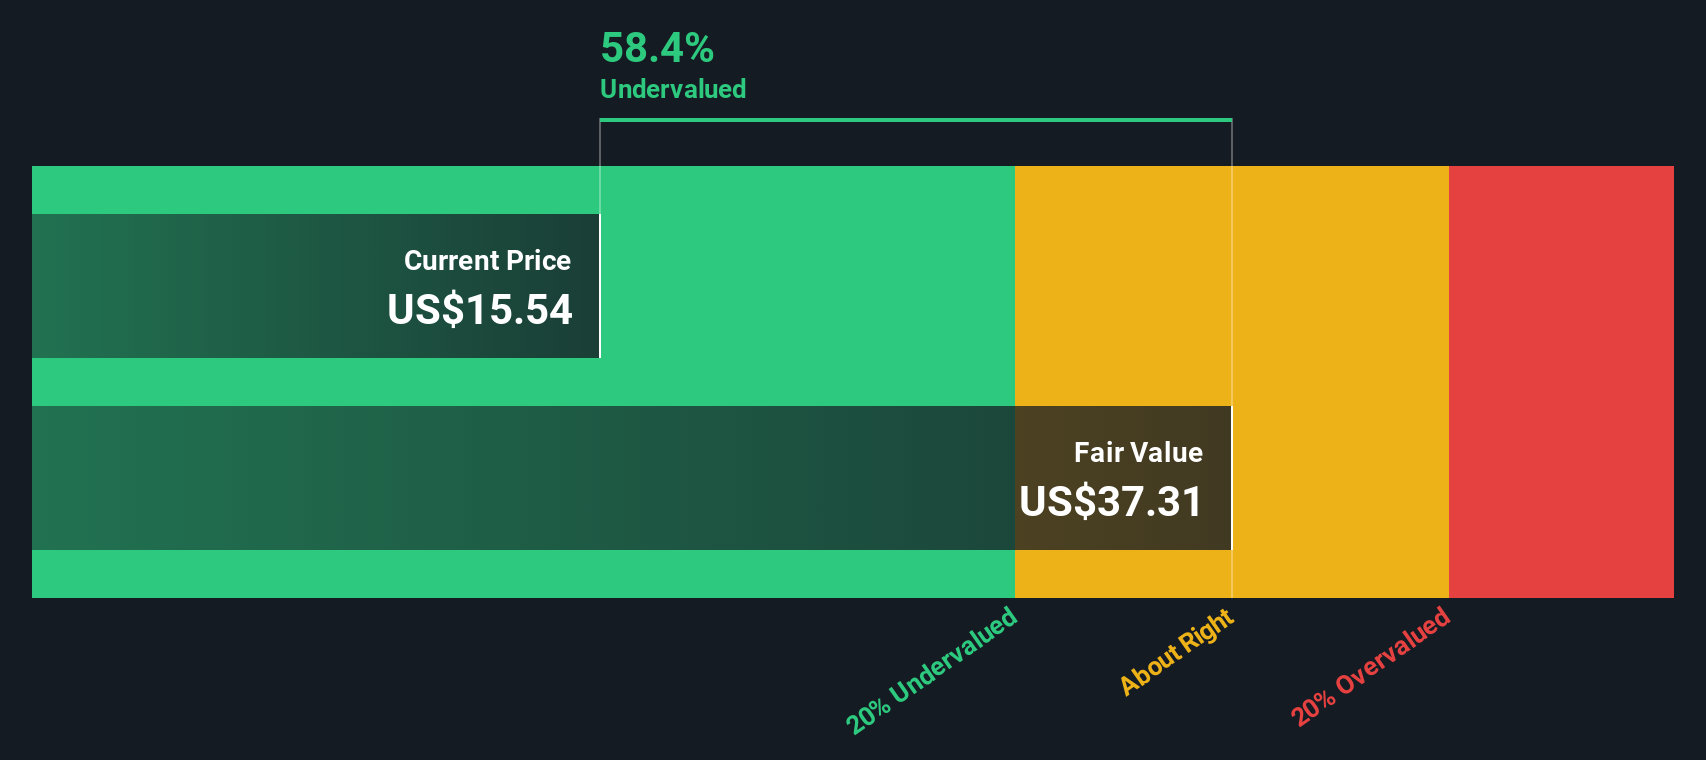
Another Take: What The DCF Model Suggests
While the current 72.4x P/E makes Monte Rosa Therapeutics look expensive, our DCF model points in a different direction. At a share price of $23.28 versus an estimated fair value of $37.43, the model suggests the stock is trading at a 37.8% discount. Which signal is more reliable: earnings multiples or long term cash flow estimates?
Look into how the SWS DCF model arrives at its fair value.
Simply Wall St performs a discounted cash flow (DCF) on every stock in the world every day (check out Monte Rosa Therapeutics for example). We show the entire calculation in full. You can track the result in your watchlist or portfolio and be alerted when this changes, or use our stock screener to discover 879 undervalued stocks based on their cash flows. If you save a screener we even alert you when new companies match - so you never miss a potential opportunity.
Build Your Own Monte Rosa Therapeutics Narrative
If you see the numbers differently or prefer to work through your own assumptions, you can quickly build a personalised view in just a few minutes using Do it your way.
A great starting point for your Monte Rosa Therapeutics research is our analysis highlighting 2 key rewards and 3 important warning signs that could impact your investment decision.
Ready For More Investment Ideas?
If Monte Rosa has caught your eye, do not stop there; the next step is to scan other focused stock ideas so you are not leaving potential opportunities on the table.
- Spot smaller names with potential by checking out these 3545 penny stocks with strong financials that meet solid fundamental filters instead of relying purely on hype.
- Zero in on future facing themes through these 27 AI penny stocks that tie artificial intelligence to real business models and financial data.
- Hunt for mispriced opportunities using these 879 undervalued stocks based on cash flows that highlight companies trading below estimated cash flow based value.
This article by Simply Wall St is general in nature. We provide commentary based on historical data and analyst forecasts only using an unbiased methodology and our articles are not intended to be financial advice. It does not constitute a recommendation to buy or sell any stock, and does not take account of your objectives, or your financial situation. We aim to bring you long-term focused analysis driven by fundamental data. Note that our analysis may not factor in the latest price-sensitive company announcements or qualitative material. Simply Wall St has no position in any stocks mentioned.
Have feedback on this article? Concerned about the content? Get in touch with us directly. Alternatively, email editorial-team@simplywallst.com