
- LIVE QUOTES
- LEARN
- HELP
 Nasdaq
 Wall Street Journal
EN
Is MercadoLibre (MELI) Pricing Reflecting Growth After Recent 1 Year 24% Share Gain
- If you are wondering whether MercadoLibre's lofty share price actually stacks up, you are not alone. The key question is whether the current market price reflects what the business might be worth.
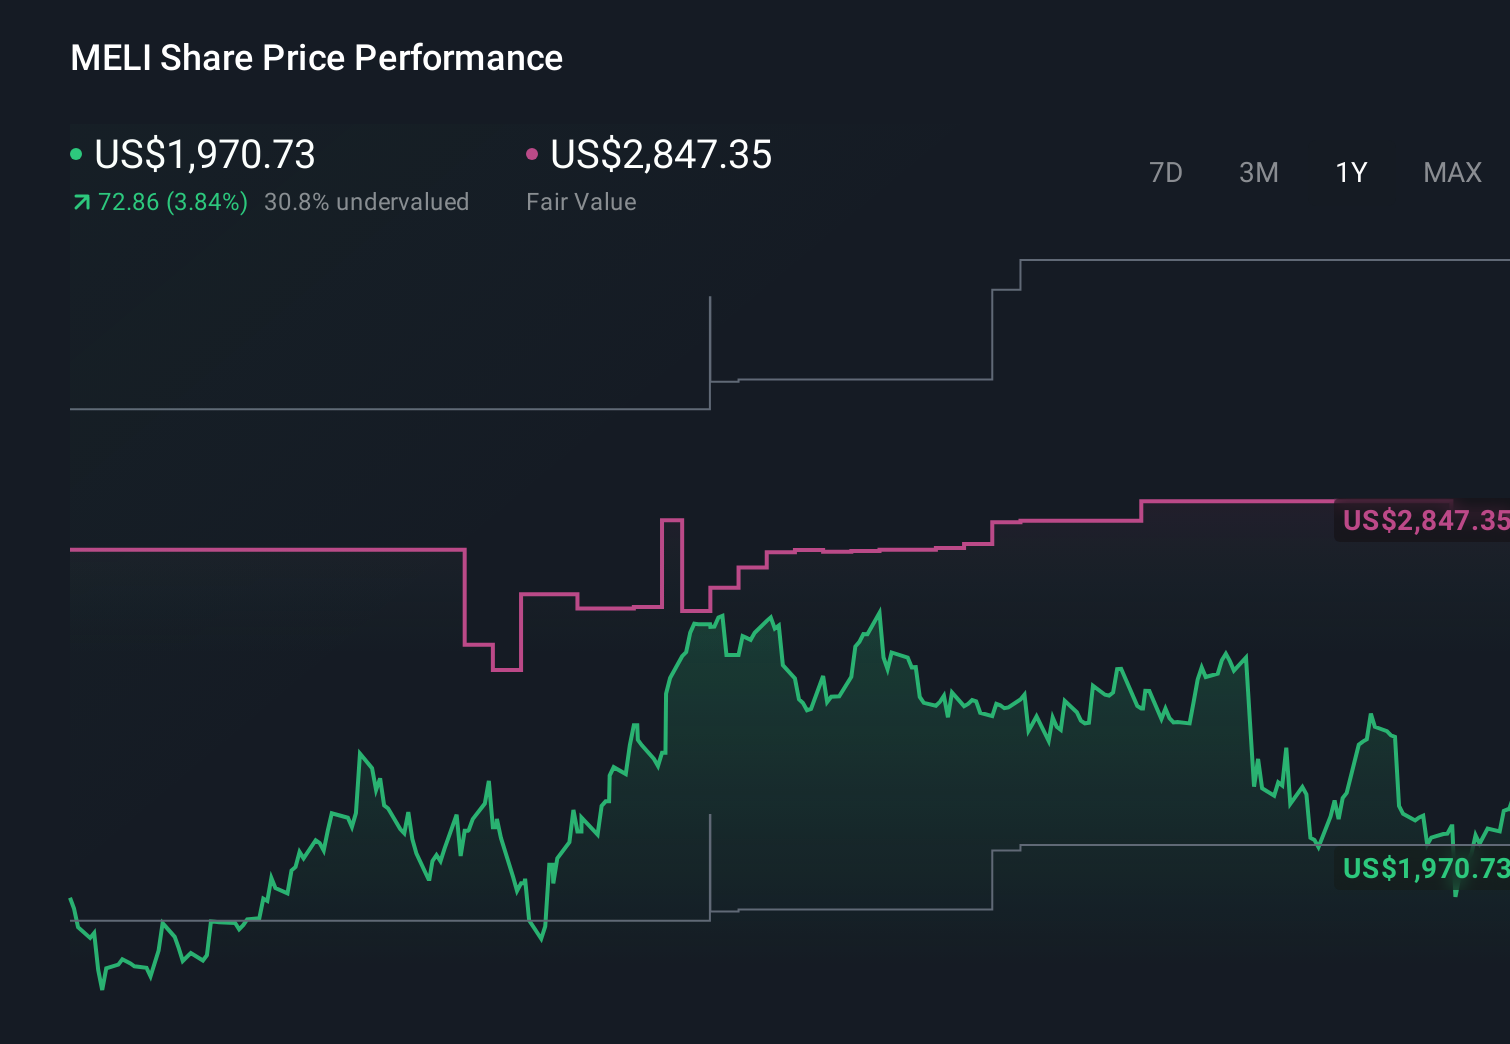
- With the stock recently closing at US$2,162.61 and returns of 7.4% over 7 days, 3.6% over 30 days, 9.6% year to date and 24.4% over 1 year, many investors are reassessing the balance between growth potential and risk.
- Recent attention on MercadoLibre has centered on its role as a major Latin American e commerce and fintech platform, which keeps it in focus whenever investors look at consumer and digital trends in the region. Alongside this, market commentary has continued to compare MercadoLibre with other large online commerce and payments companies, which can influence how investors think about its relative value.
- Simply Wall St currently gives MercadoLibre a 3 out of 6 valuation score. This suggests that some checks point to undervaluation while others are less clear. Next we will walk through the different valuation approaches before finishing with a way to put those numbers into a broader investing context.
Approach 1: MercadoLibre Discounted Cash Flow (DCF) Analysis
A Discounted Cash Flow model takes estimates of a company’s future cash flows and discounts them back to today using a required rate of return, to arrive at an estimate of what the business might be worth right now.
For MercadoLibre, the model used is a 2 Stage Free Cash Flow to Equity approach. The latest twelve month free cash flow is reported at $8.77b. Analysts have supplied free cash flow estimates out to 2027, including $10.75b for 2027, and Simply Wall St then extrapolates those forecasts further, with ten year projections stepping from $8.65b in 2026 to $15.66b in 2035. Each of these future cash flows is discounted back to today in dollar terms to build up the valuation.
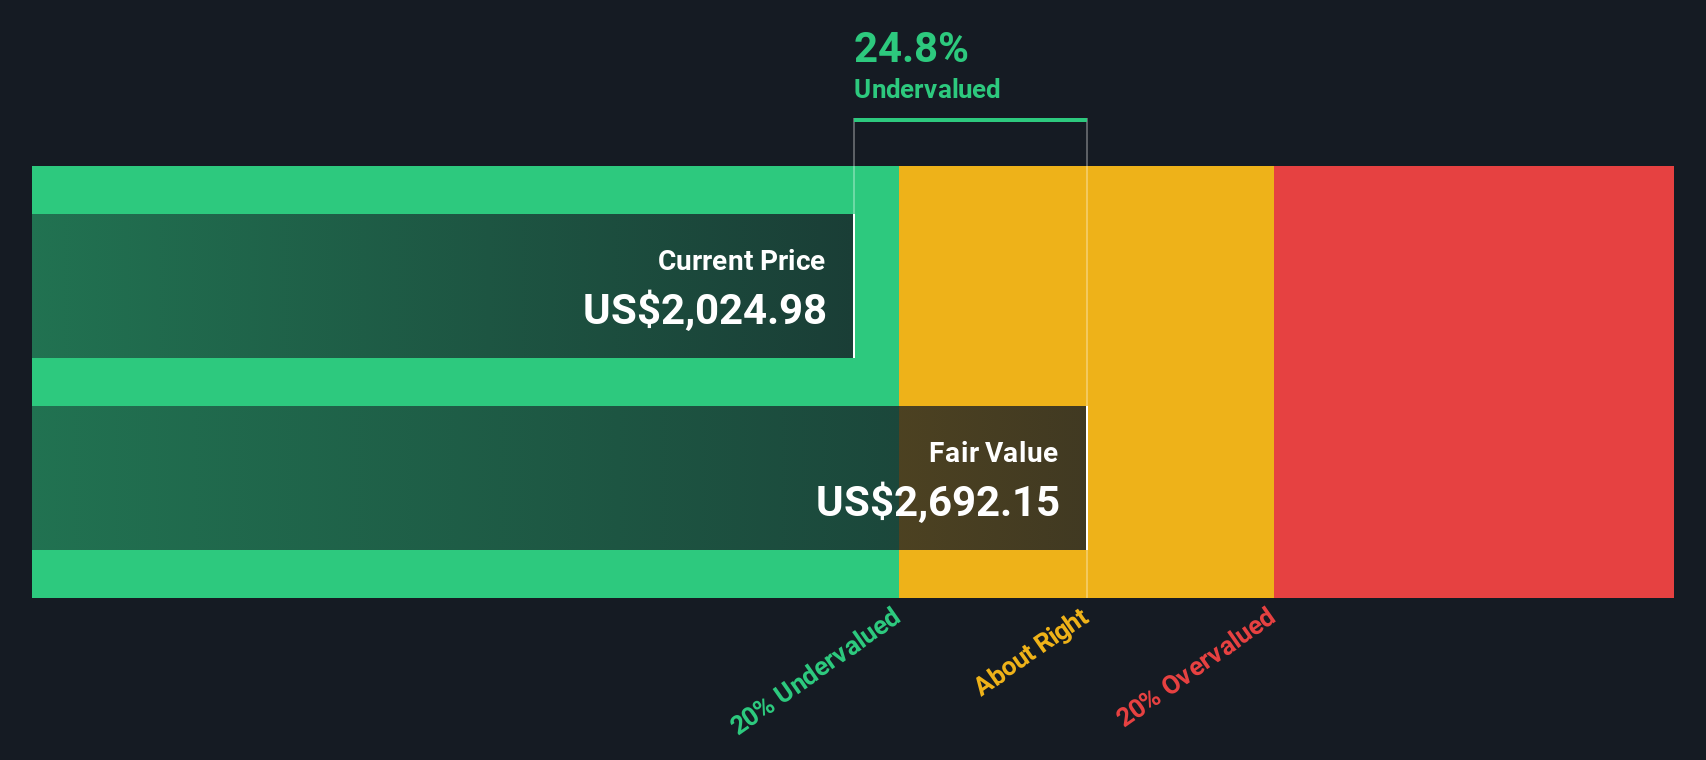
On this basis, the DCF model points to an estimated intrinsic value of $2,888.25 per share, compared with the recent share price of $2,162.61. That gap implies the shares trade at a 25.1% discount to this cash flow based estimate, which suggests the stock screens as undervalued using this method alone.
Result: UNDERVALUED
Our Discounted Cash Flow (DCF) analysis suggests MercadoLibre is undervalued by 25.1%. Track this in your watchlist or portfolio, or discover 884 more undervalued stocks based on cash flows.
Approach 2: MercadoLibre Price vs Earnings
For profitable companies, the P/E ratio is a useful way to gauge what investors are currently willing to pay for each dollar of earnings. It connects directly to the bottom line, which is ultimately what supports a share price over time.
What counts as a "normal" P/E depends a lot on how the market views a company’s growth potential and risks. Higher expected growth or perceived quality can support a higher P/E, while higher risk or weaker profitability usually justifies a lower one.
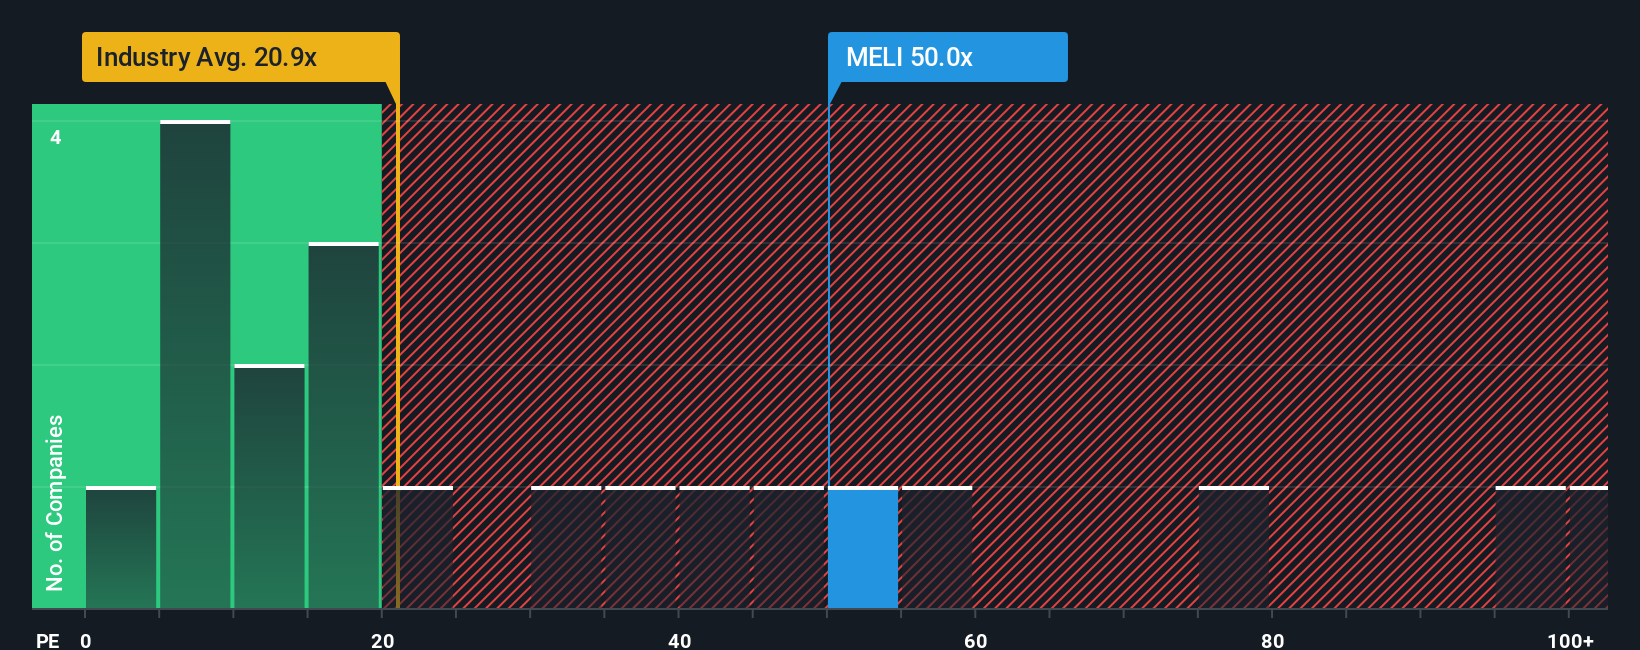
MercadoLibre currently trades on a P/E of 52.79x. That is above the Multiline Retail industry average P/E of 19.31x and also above the peer group average of 46.95x. Simply Wall St’s Fair Ratio framework estimates a P/E of 33.16x for MercadoLibre, based on factors such as its earnings growth profile, industry, profit margins, market cap and risk characteristics. This Fair Ratio is designed to be more tailored than simple peer or industry comparisons, because it adjusts for company specific qualities rather than assuming all retailers deserve similar multiples.
Comparing the current P/E of 52.79x with the Fair Ratio of 33.16x, MercadoLibre screens as trading above this Fair Ratio based benchmark.
Result: OVERVALUED
P/E ratios tell one story, but what if the real opportunity lies elsewhere? Discover 1444 companies where insiders are betting big on explosive growth.
Upgrade Your Decision Making: Choose your MercadoLibre Narrative
Earlier we mentioned that there is an even better way to understand valuation. Think of a Narrative as your own clear story for MercadoLibre that links what you believe about its future revenue, earnings and margins to a financial forecast and then to a fair value. All of this takes place within Simply Wall St's Community page where millions of investors share views. You can then compare that fair value to the current price to decide whether to act. One investor might build a Narrative around the higher US$3,500 analyst target while another leans on the lower US$2,170 target. You can also watch as those Narratives update automatically when new news or earnings data is added.
Do you think there's more to the story for MercadoLibre? Head over to our Community to see what others are saying!
This article by Simply Wall St is general in nature. We provide commentary based on historical data and analyst forecasts only using an unbiased methodology and our articles are not intended to be financial advice. It does not constitute a recommendation to buy or sell any stock, and does not take account of your objectives, or your financial situation. We aim to bring you long-term focused analysis driven by fundamental data. Note that our analysis may not factor in the latest price-sensitive company announcements or qualitative material. Simply Wall St has no position in any stocks mentioned.
Have feedback on this article? Concerned about the content? Get in touch with us directly. Alternatively, email editorial-team@simplywallst.com