
- LIVE QUOTES
- LEARN
- HELP
 Nasdaq
 Wall Street Journal
EN
Is Autoliv (ALV) Pricing Reflect Recent Auto Safety Demand And Valuation Signals Accurately
- If you are wondering whether Autoliv's current share price offers good value or is starting to look stretched, the recent numbers give you a clear starting point for that question.
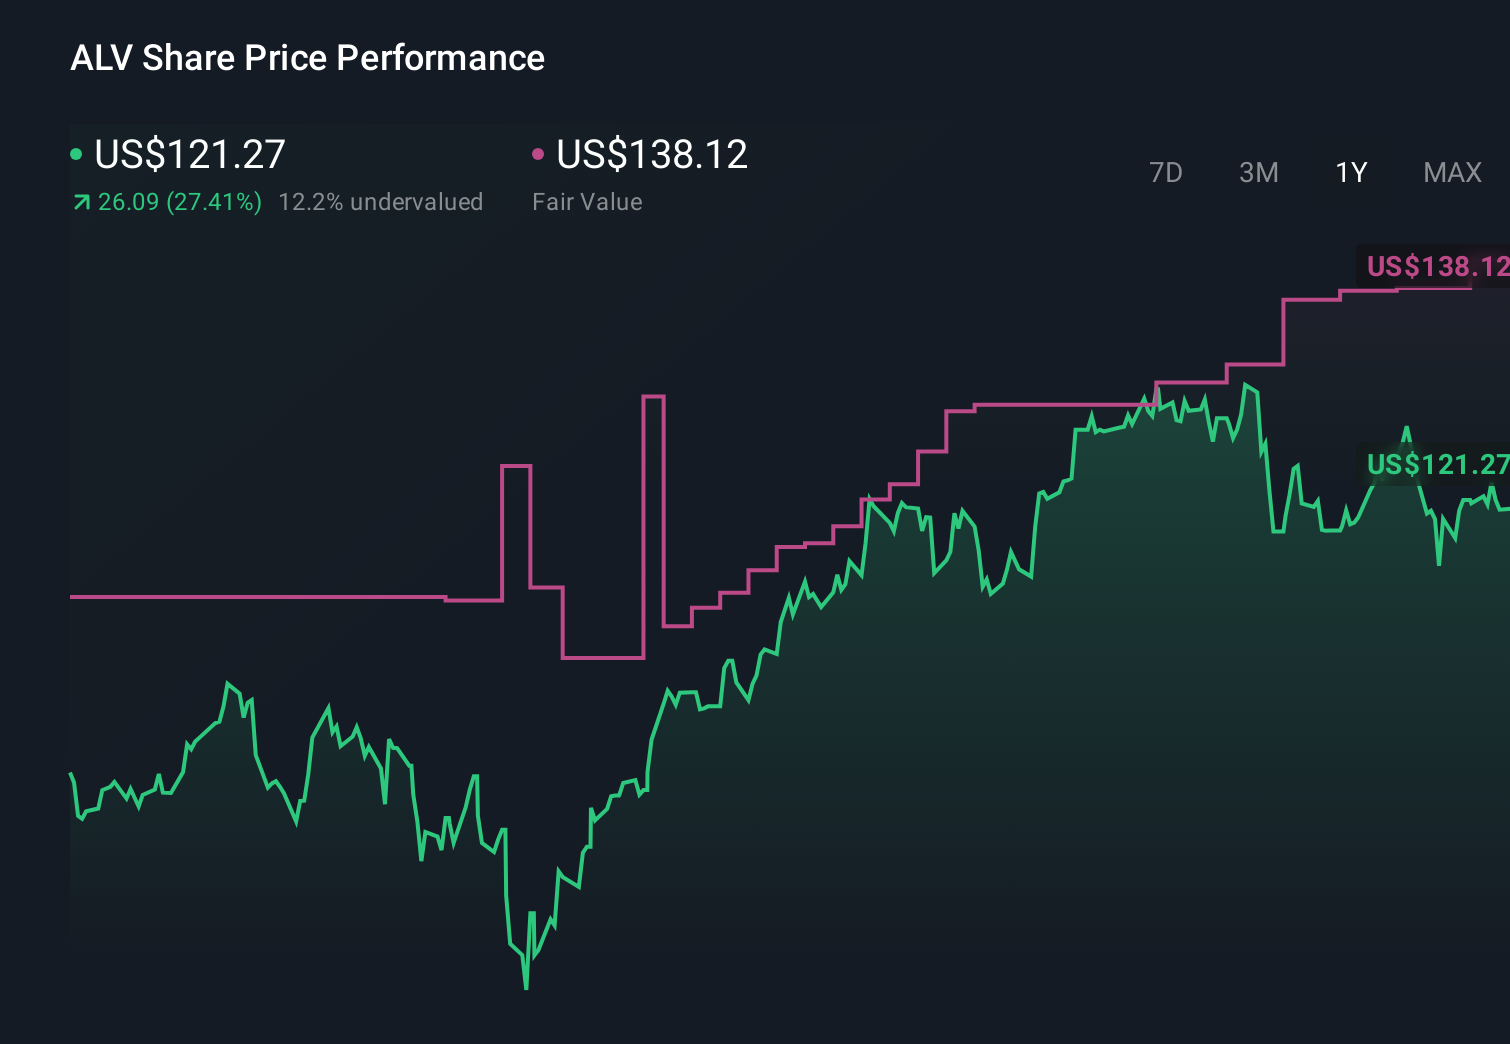
- Autoliv's stock closed at US$123.25, with returns of 3.8% over 7 days, 4.9% over 30 days, 1.0% year to date, 35.7% over 1 year, 66.6% over 3 years, and 53.1% over 5 years. This provides plenty of history to weigh against the present price.
- Recent company updates and industry headlines around auto safety suppliers have kept attention on Autoliv. Investors are watching how global vehicle production trends and safety content per vehicle are influencing sentiment. These factors help frame the recent share price performance and set the context for any valuation work you might do.
- On our valuation checks, Autoliv scores 5/6, which points to several measures where the stock screens as potentially undervalued. Next, we look at what different valuation approaches say about this result and why an even deeper way of thinking about value can be useful by the end of the article.
Approach 1: Autoliv Discounted Cash Flow (DCF) Analysis
A Discounted Cash Flow model takes estimates of a company’s future cash flows, then discounts them back to what they are worth in today’s dollars. It is essentially asking what Autoliv’s future cash generation is worth right now.
For Autoliv, the model used is a 2 Stage Free Cash Flow to Equity approach, based on cash flow projections in US$. The latest twelve month free cash flow is about $474.4 million. Analysts provide specific forecasts for the next few years, and Simply Wall St extends these into longer term projections, including an estimated free cash flow of $761.6 million in 2035.
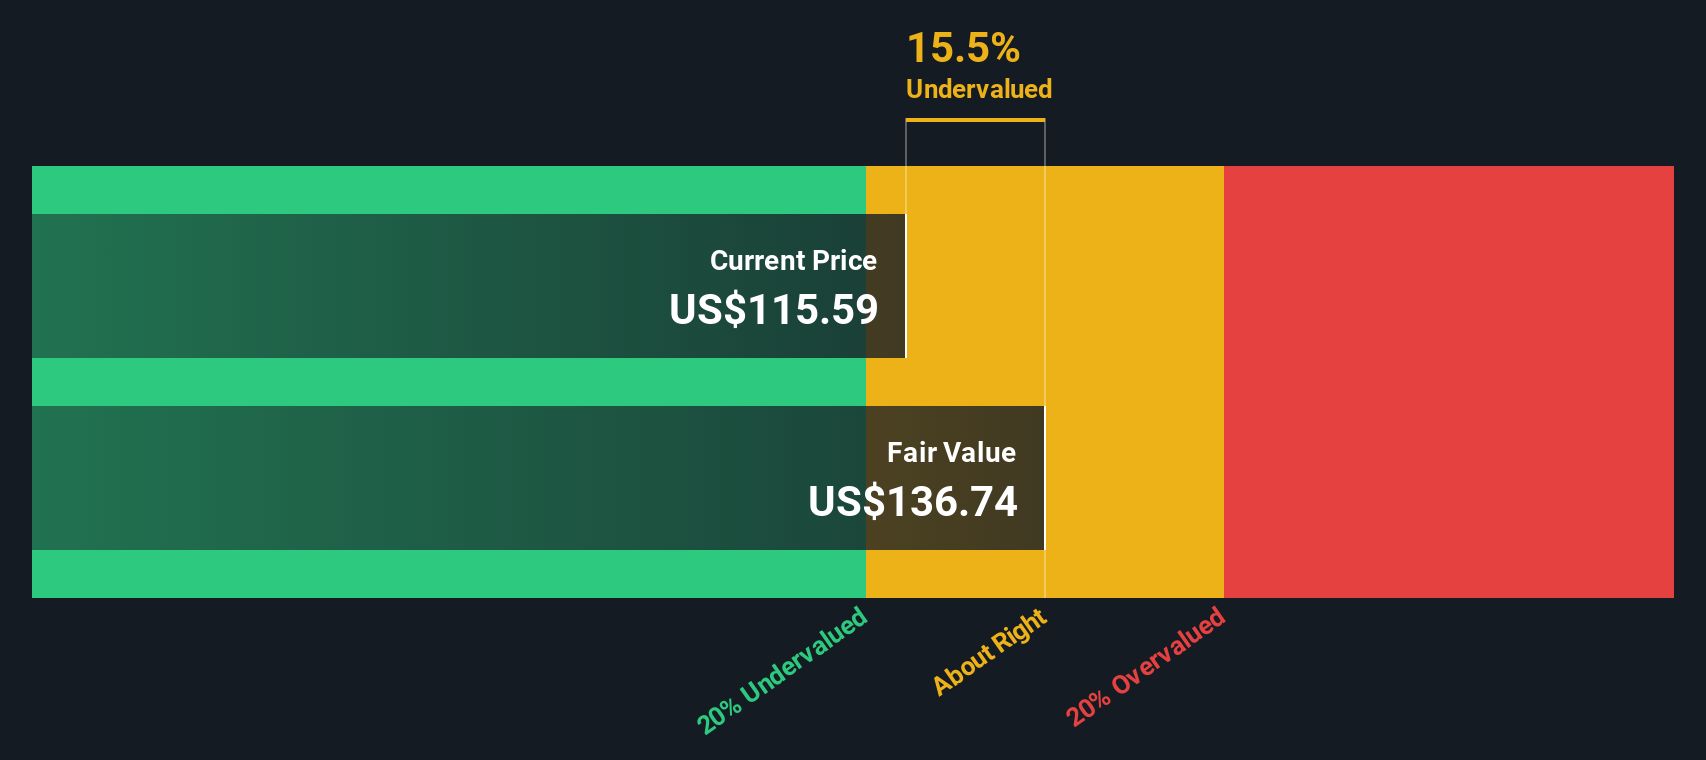
When all those projected cash flows are discounted back using this model, the estimated intrinsic value comes out at about $160.35 per share. Compared with the recent share price of $123.25, the DCF output suggests Autoliv trades at a 23.1% discount to this estimate, which indicates that the shares look inexpensive on this measure.
Result: UNDERVALUED
Our Discounted Cash Flow (DCF) analysis suggests Autoliv is undervalued by 23.1%. Track this in your watchlist or portfolio, or discover 884 more undervalued stocks based on cash flows.
Approach 2: Autoliv Price vs Earnings (P/E)
For a profitable company like Autoliv, the P/E ratio is a useful gauge because it links what you pay directly to the earnings the business is currently generating. Investors usually accept a higher P/E when they expect stronger growth or see lower risk, while slower growth or higher risk tends to justify a lower, more cautious multiple.
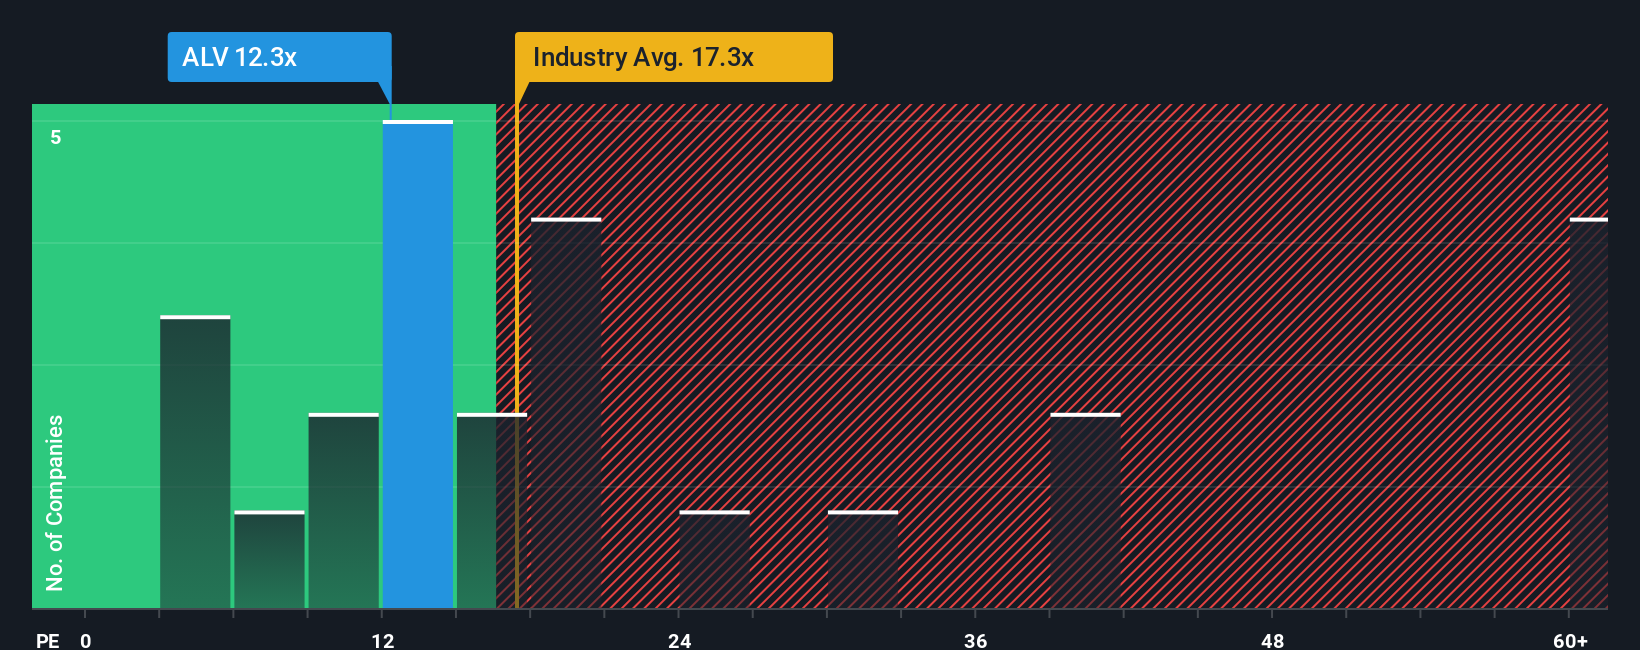
Autoliv currently trades on a P/E of 12.24x. That sits below both the Auto Components industry average P/E of 20.42x and the broader peer group average of 40.83x. Simply Wall St also calculates a Fair Ratio of 13.52x, which is the P/E they would expect for Autoliv given factors such as its earnings profile, industry, profit margins, market value and company specific risks.
This Fair Ratio is more tailored than a simple peer or sector comparison because it adjusts for Autoliv’s own characteristics rather than assuming all companies in the group deserve similar multiples. Comparing the current 12.24x P/E with the 13.52x Fair Ratio points to Autoliv trading below this model based estimate.
Result: UNDERVALUED
P/E ratios tell one story, but what if the real opportunity lies elsewhere? Discover 1443 companies where insiders are betting big on explosive growth.
Upgrade Your Decision Making: Choose your Autoliv Narrative
Earlier we mentioned that there is an even better way to understand valuation. Narratives let you attach a clear story about Autoliv to the numbers by tying your view on its future revenue, earnings and margins to a financial forecast and a fair value. This is all inside an easy tool on Simply Wall St's Community page that updates as new news or earnings arrive and helps you compare that fair value with the current share price to decide if Autoliv looks attractive to you, whether your story is closer to a more optimistic view that leans toward assumptions behind a higher fair value such as around US$145 per share, or a more cautious view that sits nearer to a lower figure around US$106 per share.
Do you think there's more to the story for Autoliv? Head over to our Community to see what others are saying!
This article by Simply Wall St is general in nature. We provide commentary based on historical data and analyst forecasts only using an unbiased methodology and our articles are not intended to be financial advice. It does not constitute a recommendation to buy or sell any stock, and does not take account of your objectives, or your financial situation. We aim to bring you long-term focused analysis driven by fundamental data. Note that our analysis may not factor in the latest price-sensitive company announcements or qualitative material. Simply Wall St has no position in any stocks mentioned.
Have feedback on this article? Concerned about the content? Get in touch with us directly. Alternatively, email editorial-team@simplywallst.com