
- LIVE QUOTES
- LEARN
- HELP
 Nasdaq
 Wall Street Journal
EN
Is It Too Late To Consider Triple Flag Precious Metals (TSX:TFPM) After 121% One Year Rally?
- If you are wondering whether Triple Flag Precious Metals is priced attractively right now, a useful starting point is understanding how its current share price lines up against a few key valuation checks.
- The stock last closed at $48.28, with returns of 5.9% over 7 days, 7.6% over 30 days, 7.4% year to date, and 120.6% over the past year. These figures can influence how investors think about both potential upside and risk.
- Recent attention on gold and precious metals royalties, including Triple Flag Precious Metals, has kept investor interest elevated, as royalty and streaming models continue to be compared with traditional mining businesses. This broader conversation around exposure to metals prices without direct operating risk provides useful context for the strong share price moves being observed.
- On Simply Wall St's valuation checks, Triple Flag Precious Metals scores 1 out of 6, as shown in its valuation score. Next, we will look at what different valuation approaches indicate about the stock, then finish with a more complete way to think about value that goes beyond any single metric.
Triple Flag Precious Metals scores just 1/6 on our valuation checks. See what other red flags we found in the full valuation breakdown.
Approach 1: Triple Flag Precious Metals Discounted Cash Flow (DCF) Analysis
A Discounted Cash Flow, or DCF, model estimates what a business could be worth today by projecting its future cash flows and then discounting those back to a present value.
For Triple Flag Precious Metals, the model used is a 2 Stage Free Cash Flow to Equity approach, based on cash flow projections in $. The latest twelve month free cash flow is $66.19 million. Analyst estimates feed into the earlier years, with Simply Wall St extrapolating further out, including a projected free cash flow of $370.00 million in 2028 and additional estimates through 2035 under its ten year projection framework.
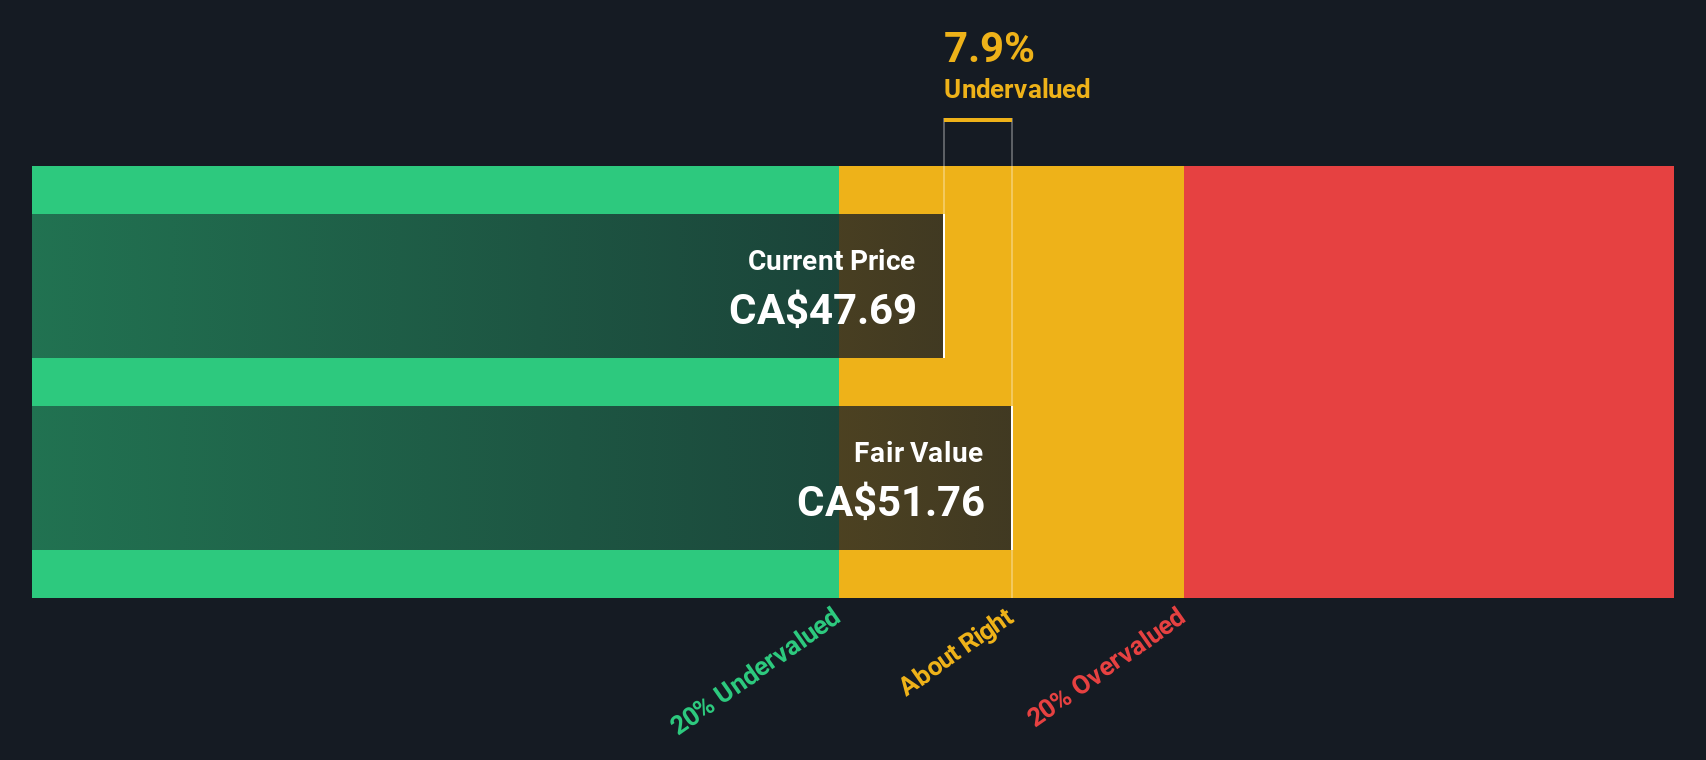
Pulling these projected cash flows together, the DCF model arrives at an estimated intrinsic value of $51.18 per share. Compared with the recent share price of CA$48.28, this implies the shares trade at roughly a 5.7% discount to that DCF estimate, which is a relatively small gap.
In other words, based on this cash flow view, Triple Flag Precious Metals appears close to fairly priced with a slight lean toward being inexpensive.
Result: ABOUT RIGHT
Triple Flag Precious Metals is fairly valued according to our Discounted Cash Flow (DCF), but this can change at a moment's notice. Track the value in your watchlist or portfolio and be alerted on when to act.
Approach 2: Triple Flag Precious Metals Price vs Earnings
For a profitable company like Triple Flag Precious Metals, the P/E ratio is a useful way to see how much investors are paying for each dollar of earnings. It connects the share price directly to current profits, which is often the anchor for many investors’ expectations.
What counts as a “normal” or “fair” P/E depends on how the market views a company’s growth potential and risk. Higher expected growth or lower perceived risk can support a higher P/E, while slower growth or higher risk usually points to a lower multiple.
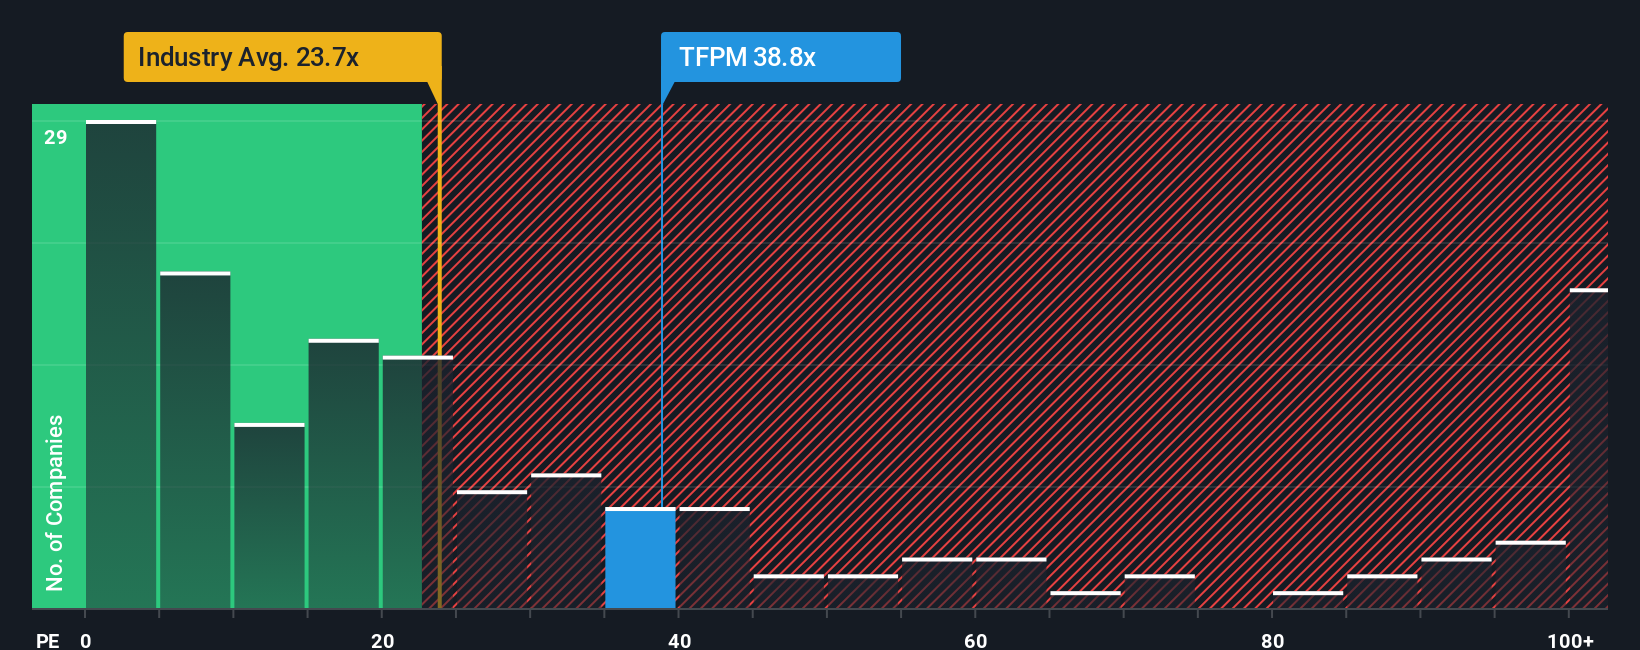
Triple Flag Precious Metals currently trades on a P/E of 35.21x. That sits above both the Metals and Mining industry average of 23.38x and a peer group average of 22.71x, so on simple comparisons the stock appears more expensive than many of its peers.
Simply Wall St’s Fair Ratio for Triple Flag Precious Metals is 20.61x. This is a proprietary estimate of what a reasonable P/E could be given factors such as earnings growth, profit margins, industry, market cap and risk. Because it incorporates these company specific inputs, it can provide a more tailored reference point than broad peer or industry averages alone.
Comparing the Fair Ratio of 20.61x with the current P/E of 35.21x, the shares appear to be trading on a richer multiple than that model would suggest.
Result: OVERVALUED
P/E ratios tell one story, but what if the real opportunity lies elsewhere? Discover 1443 companies where insiders are betting big on explosive growth.
Upgrade Your Decision Making: Choose your Triple Flag Precious Metals Narrative
Earlier we mentioned that there is an even better way to think about valuation. On Simply Wall St you can build or follow a Narrative, which is simply your story about Triple Flag Precious Metals linked to your own forecasts for revenue, earnings, margins and a fair value that you can then compare with the current price.
A Narrative connects three pieces in one place: what you think is happening with the business, how that translates into future financials, and what you believe is a reasonable valuation today.
On the Simply Wall St Community page, Narratives are designed to be easy to use. You can see different fair values, update your assumptions when new earnings or news arrive, and quickly spot when your view of fair value is above or below the live share price.
For Triple Flag Precious Metals, one investor might lean toward the higher fair value end, closer to CA$52.52, because they expect stronger revenue growth and margins. Another might sit nearer the lower end, around CA$34.76, if they are more cautious about risks such as asset concentration, deal execution and future profit margins.
Do you think there's more to the story for Triple Flag Precious Metals? Head over to our Community to see what others are saying!

This article by Simply Wall St is general in nature. We provide commentary based on historical data and analyst forecasts only using an unbiased methodology and our articles are not intended to be financial advice. It does not constitute a recommendation to buy or sell any stock, and does not take account of your objectives, or your financial situation. We aim to bring you long-term focused analysis driven by fundamental data. Note that our analysis may not factor in the latest price-sensitive company announcements or qualitative material. Simply Wall St has no position in any stocks mentioned.
Have feedback on this article? Concerned about the content? Get in touch with us directly. Alternatively, email editorial-team@simplywallst.com