
- LIVE QUOTES
- LEARN
- HELP
 Nasdaq
 Wall Street Journal
EN
Is GameStop (GME) Pricing Reflect Recent Meme Stock Volatility And DCF Upside Potential
- If you are wondering whether GameStop's current share price lines up with its underlying worth, you are not alone. That is exactly what this article will help you assess.
- Over the last week, the stock returned 6.0%. The 30 day return sits at an 8.8% decline and the 1 year return is a 34.6% decline, while the 5 year return is 174.4%. This can make the risk and reward profile feel quite different depending on your time frame.
- Recent coverage has continued to focus on GameStop's role as a meme stock and the way trading sentiment can affect its share price, alongside ongoing discussion of its position in the retail and gaming market. Together, these themes help explain why short term swings can be pronounced even when fundamental changes appear slower to filter through.
- On our checks, GameStop scores a 2 out of 6 valuation score. We will break this down using several common approaches before turning to a more complete way to think about the company's value at the end of the article.
GameStop scores just 2/6 on our valuation checks. See what other red flags we found in the full valuation breakdown.
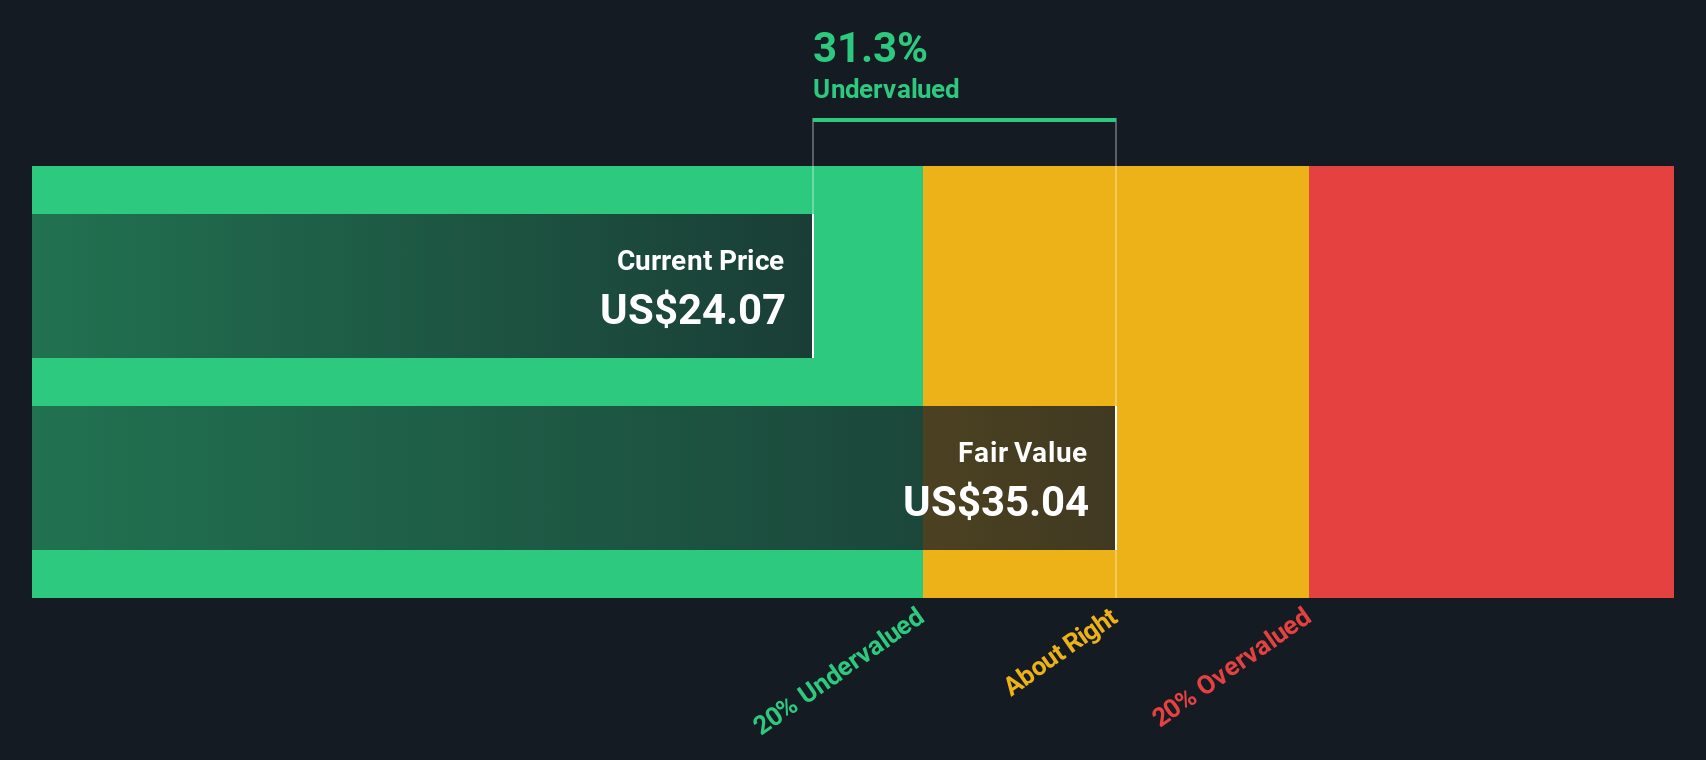
Approach 1: GameStop Discounted Cash Flow (DCF) Analysis
A Discounted Cash Flow, or DCF, model estimates what a company might be worth by projecting future cash flows and discounting them back to today using a required rate of return. It is essentially asking what all those future cash flows are worth in today's dollars.
For GameStop, the model starts with last twelve month free cash flow of about $563.2 million, using a 2 Stage Free Cash Flow to Equity approach. Simply Wall St then projects free cash flow out to 2035, with each year discounted back to today. By 2035, the model is using an estimated free cash flow of about $4.5b, although forecasts beyond around five years are extrapolated rather than based on direct analyst estimates.
Putting all of these discounted cash flows together gives an estimated intrinsic value of $99.45 per share. Based on this DCF output, the shares are indicated to be 78.6% undervalued compared with the current market price, which is a substantial gap between modeled value and where the stock trades today.
Result: UNDERVALUED
Our Discounted Cash Flow (DCF) analysis suggests GameStop is undervalued by 78.6%. Track this in your watchlist or portfolio, or discover 884 more undervalued stocks based on cash flows.
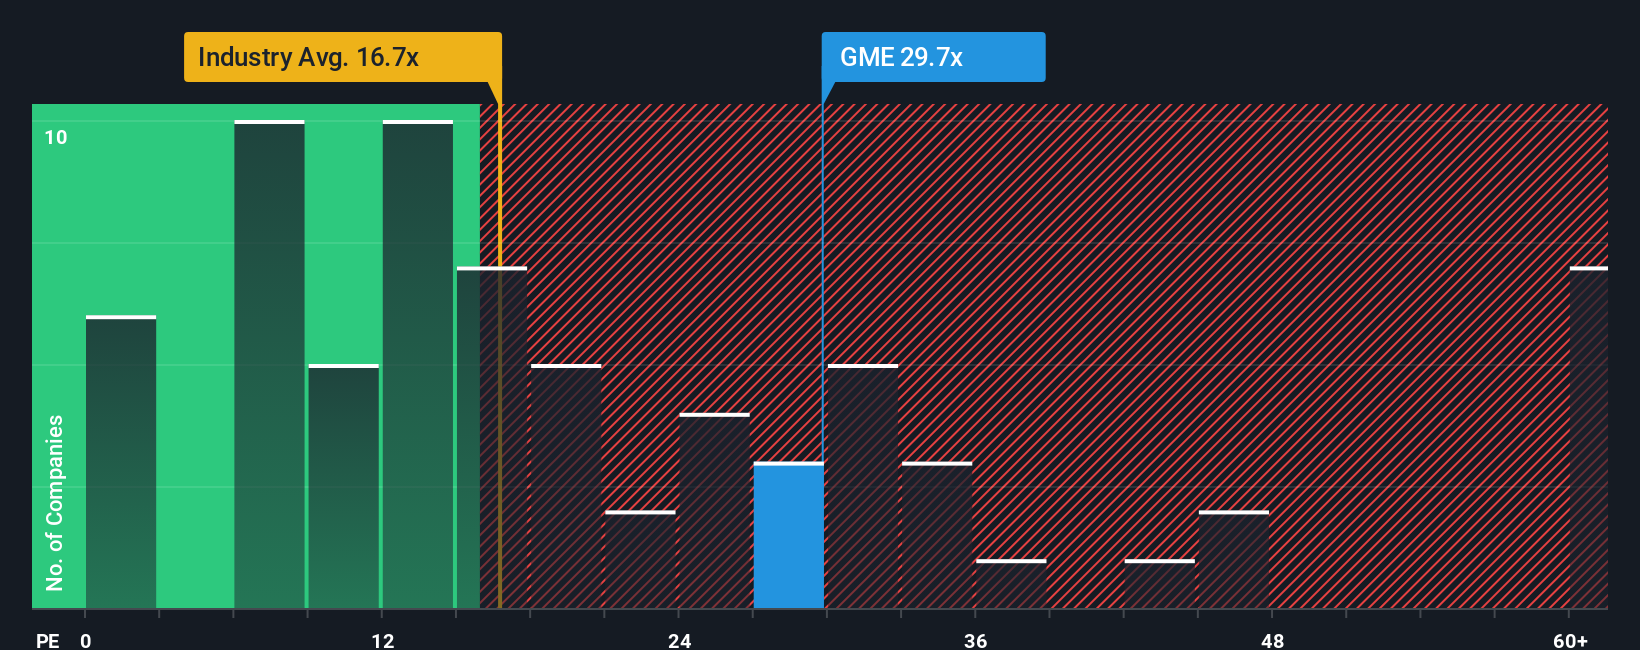
Approach 2: GameStop Price vs Earnings
For a company that is generating earnings, the P/E ratio is a useful shorthand for how much investors are paying for each dollar of profit. It ties directly to what you see on the income statement, which makes it easier to compare across time and against other businesses.
What counts as a "fair" P/E often reflects how the market views the company’s growth prospects and risk. Higher expected growth or lower perceived risk can support a higher P/E, while slower growth or higher risk usually lines up with a lower P/E.
GameStop currently trades on a P/E of 22.61x. That sits above the Specialty Retail industry average of about 20.25x and the peer group average of 20.66x. Simply Wall St also uses a proprietary Fair Ratio, which is the P/E you might expect once you factor in GameStop’s earnings growth profile, industry, profit margins, market cap and risk characteristics. This Fair Ratio is designed to be more tailored than a simple comparison with peers or the broad industry, because it tries to adjust for what makes GameStop different rather than assuming all retailers deserve the same multiple.
As the Fair Ratio for GameStop is not available here, we cannot draw a firm conclusion from this method alone.
Result: ABOUT RIGHT
P/E ratios tell one story, but what if the real opportunity lies elsewhere? Discover 1443 companies where insiders are betting big on explosive growth.
Upgrade Your Decision Making: Choose your GameStop Narrative
Earlier we mentioned that there is an even better way to think about valuation, and that is where Narratives come in, because they let you attach a clear story about GameStop to your numbers, including your own fair value, revenue, earnings and margin assumptions, then link that story to a forecast and a value that you can easily compare to today’s share price inside the Narratives tool on Simply Wall St’s Community page.
Instead of only looking at ratios or a single model, you set out your view of the business. The platform converts that story into projected cash flows and a fair value. It then highlights whether your view suggests the stock looks cheap or expensive compared with the current market price, which can help you decide if, or when, you might want to act.
Narratives are not static. They refresh when new information such as earnings, news or updated financials is added, so your story and its implied value move with the company rather than staying frozen.
For example, one GameStop Narrative on the Community page assigns a fair value of US$220.00 per share, while another assigns US$11.91. This shows how two investors looking at the same company can reach very different conclusions once they plug their own assumptions into the same framework.
For GameStop however we will make it really easy for you with previews of two leading GameStop Narratives:
Fair value in this narrative: US$220.00 per share
Implied discount to that fair value versus the last close of US$21.29: about 90.3% undervalued using ((220.00 - 21.29) / 220.00)
Revenue growth assumption used in this narrative: 31.15%
- Focuses on GameStop as a profitable, cash rich company, highlighting net profit in recent quarters, a large cash position and no long term debt.
- Emphasizes Ryan Cohen’s role, performance based incentives and cost cutting, including store closures and exiting certain markets, as drivers of improved margins and earnings.
- Points to Bitcoin holdings, high levels of directly registered shares and the possibility of future index inclusion as key parts of a long term upside thesis.
Fair value in this narrative: US$11.91 per share
Implied premium to that fair value versus the last close of US$21.29: about 78.8% overvalued using ((21.29 - 11.91) / 11.91)
Revenue growth assumption used in this narrative: 0.0%
- Highlights the pressure on GameStop’s traditional retail model from digital game distribution and online competitors, with revenue of US$860m in a recent quarter and a 20% decline in that period.
- Notes that while cost cuts and initiatives like the Zip BNPL partnership have supported profitability, the overall business still faces headwinds and uncertainty around crypto related moves.
- Stresses that meme stock trading, social media influence and speculative interest have driven large price swings that may not line up with the company’s underlying results.
Together these two narratives show how different assumptions on profitability, balance sheet strength, crypto exposure and the impact of meme trading can lead to very different views of what GameStop’s shares are worth. If you find yourself leaning toward one side, it can help to check that your own expectations for cash flows, margins and risk are consistent with the story you are telling yourself about the stock.
Curious how numbers become stories that shape markets? Explore Community Narratives
Do you think there's more to the story for GameStop? Head over to our Community to see what others are saying!

This article by Simply Wall St is general in nature. We provide commentary based on historical data and analyst forecasts only using an unbiased methodology and our articles are not intended to be financial advice. It does not constitute a recommendation to buy or sell any stock, and does not take account of your objectives, or your financial situation. We aim to bring you long-term focused analysis driven by fundamental data. Note that our analysis may not factor in the latest price-sensitive company announcements or qualitative material. Simply Wall St has no position in any stocks mentioned.
Have feedback on this article? Concerned about the content? Get in touch with us directly. Alternatively, email editorial-team@simplywallst.com