
- LIVE QUOTES
- LEARN
- HELP
 Nasdaq
 Wall Street Journal
EN
Is APA (APA) Pricing Signal A Value Opportunity After Recent Share Price Pullback
- If you are wondering whether APA is attractively priced or just a value trap, starting with a clear look at what the current share price reflects can help you frame your next move.
- The stock recently closed at US$23.39, with returns of 4.0% over the past year but short-term pullbacks of 4.4% over 7 days, 10.5% over 30 days and 7.8% year to date, on top of a 40.4% loss over 3 years and a 50.0% gain over 5 years.
- Recent headlines around APA have focused on its position in the energy sector and how investors are weighing commodity price swings against the company’s asset base and capital plans. This backdrop helps explain why the share price has moved in different directions over shorter and longer time frames.
- APA currently scores 5 out of 6 on our valuation checks, indicating a value score of 5, and next we will look at how different valuation methods arrive at that outcome and why there may be an even better way to think about what the stock is really worth by the end of this article.
Approach 1: APA Discounted Cash Flow (DCF) Analysis
A Discounted Cash Flow model estimates what a company could be worth by projecting its future cash flows and then discounting those back to today in dollar terms. It is essentially asking what all those future cash flows are worth right now.
For APA, the model used is a 2 Stage Free Cash Flow to Equity approach, built on last twelve month free cash flow of about $1.96b. Analyst and extrapolated estimates in the model point to projected free cash flow of $2.16b in 2030, with a detailed path of annual projections between 2026 and 2035 that are converted into present values using a discount rate.
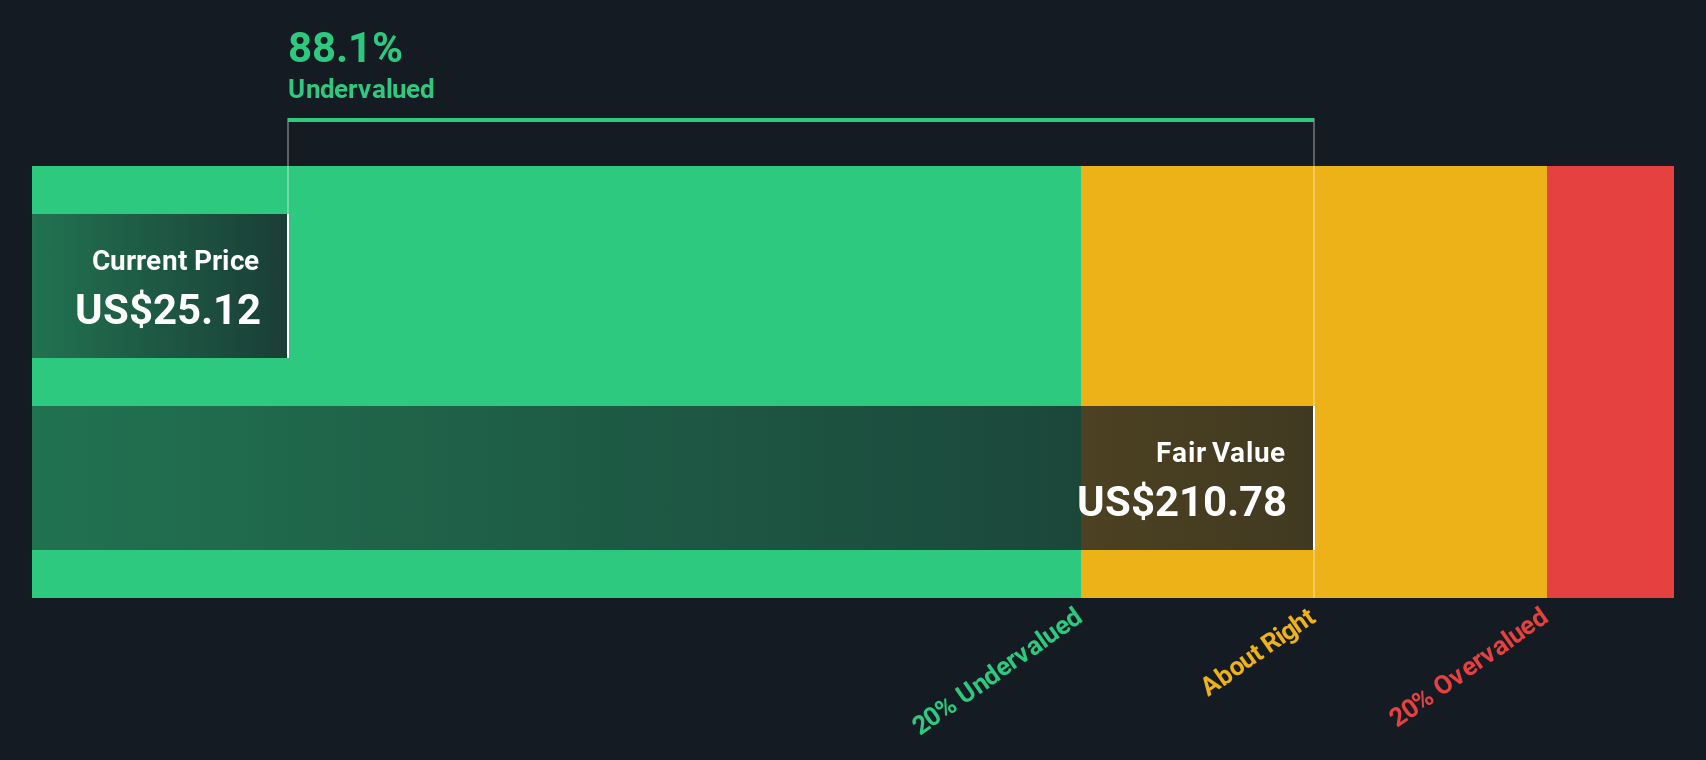
Adding these discounted cash flows together gives an estimated intrinsic value of US$109.50 per share. Compared with the recent share price of US$23.39, the model output suggests an implied discount of 78.6%, which indicates the stock appears significantly undervalued on this DCF basis.
Result: UNDERVALUED
Our Discounted Cash Flow (DCF) analysis suggests APA is undervalued by 78.6%. Track this in your watchlist or portfolio, or discover 884 more undervalued stocks based on cash flows.
Approach 2: APA Price vs Earnings
The P/E ratio is a common way to value profitable companies because it links what you pay for each share to the earnings that business is currently generating. In general, higher expected growth and lower perceived risk tend to support a higher “normal” P/E, while slower growth or higher risk usually align with a lower one.
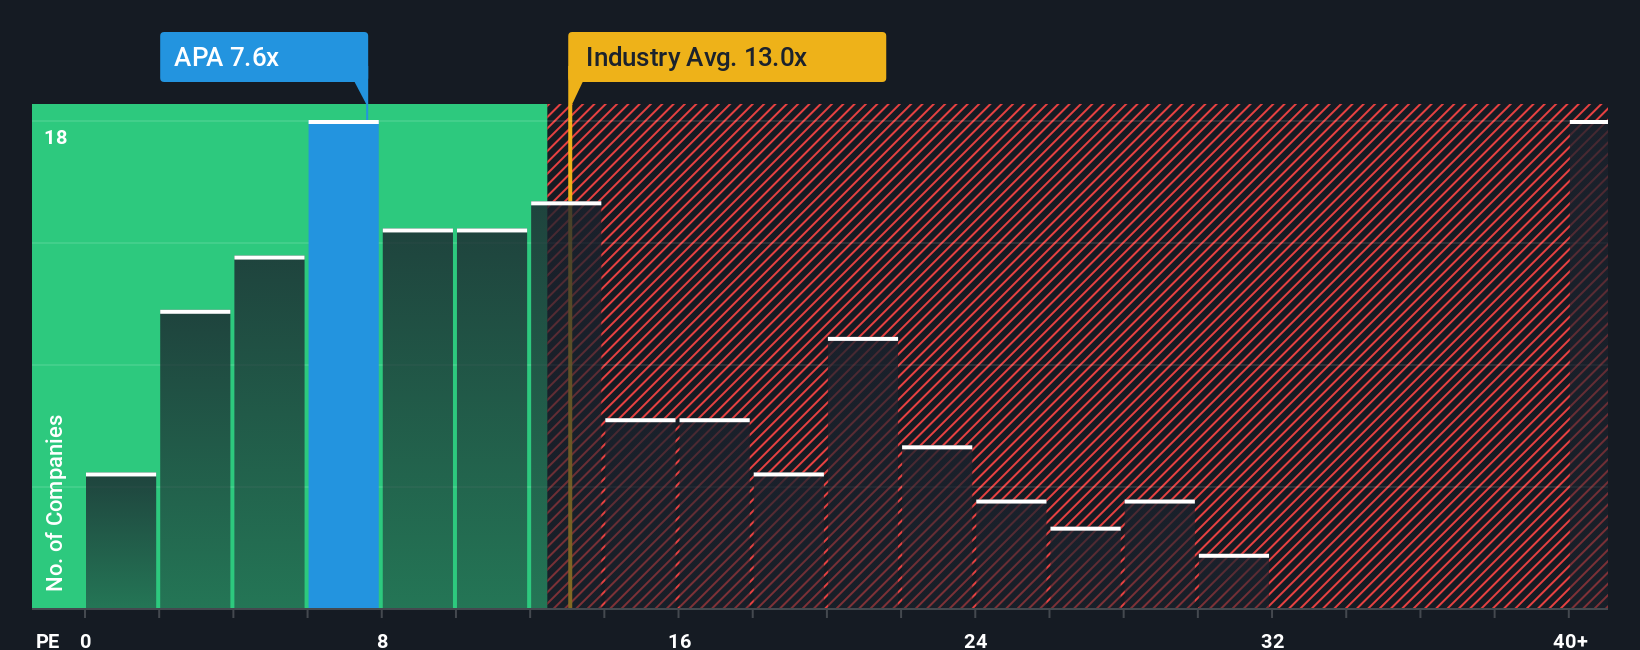
APA currently trades on a P/E of 5.50x. That sits below the Oil and Gas industry average of about 13.03x and is also well under a broader peer group average of 21.98x. Simply Wall St adds another layer with its proprietary “Fair Ratio”, which estimates what a more tailored P/E might look like for APA given factors such as earnings growth, industry, profit margins, market cap and company specific risks.
This Fair Ratio for APA is 15.20x, and it can be more informative than raw peer or industry comparisons because it adjusts for those company specific characteristics rather than assuming one size fits all. Comparing APA’s actual P/E of 5.50x with the Fair Ratio of 15.20x indicates the shares are trading below the level implied by these fundamentals.
Result: UNDERVALUED
P/E ratios tell one story, but what if the real opportunity lies elsewhere? Discover 1443 companies where insiders are betting big on explosive growth.
Upgrade Your Decision Making: Choose your APA Narrative
Earlier we mentioned that there is an even better way to understand valuation. Let us introduce you to Narratives, which let you turn your view of APA into a simple story that links assumptions about future revenue, earnings and margins to a forecast, a fair value, and a clear comparison with the current price. All of this is available within an easy tool on Simply Wall St’s Community page that updates when new news or earnings arrive. One investor might build a bullish APA Narrative around cost efficiencies, Egypt expansion and a fair value near US$26.14. Another might focus on risks such as commodity exposure, decommissioning costs and a fair value closer to US$16. You can see these different stories side by side to help decide how APA fits your own buy or sell thresholds.
Do you think there's more to the story for APA? Head over to our Community to see what others are saying!

This article by Simply Wall St is general in nature. We provide commentary based on historical data and analyst forecasts only using an unbiased methodology and our articles are not intended to be financial advice. It does not constitute a recommendation to buy or sell any stock, and does not take account of your objectives, or your financial situation. We aim to bring you long-term focused analysis driven by fundamental data. Note that our analysis may not factor in the latest price-sensitive company announcements or qualitative material. Simply Wall St has no position in any stocks mentioned.
Have feedback on this article? Concerned about the content? Get in touch with us directly. Alternatively, email editorial-team@simplywallst.com