
- LIVE QUOTES
- LEARN
- HELP
 Nasdaq
 Wall Street Journal
EN
Global Growth Companies With High Insider Ownership In January 2026
As the global markets navigate a landscape marked by fluctuating indices and economic shifts, investors are keeping a close eye on key indicators such as rising U.S. home sales and mixed performances across major stock exchanges. In this environment, growth companies with high insider ownership can be particularly appealing, as they often demonstrate strong alignment between management and shareholder interests, potentially offering resilience amid market volatility.
Top 10 Growth Companies With High Insider Ownership Globally
| Name | Insider Ownership | Earnings Growth |
| Streamax Technology (SZSE:002970) | 32.5% | 33.1% |
| Phison Electronics (TPEX:8299) | 10.8% | 30.2% |
| Modetour Network (KOSDAQ:A080160) | 12.7% | 41.8% |
| Loadstar Capital K.K (TSE:3482) | 31% | 23.6% |
| Laopu Gold (SEHK:6181) | 34.8% | 34.3% |
| KebNi (OM:KEBNI B) | 35% | 61.2% |
| J&V Energy Technology (TWSE:6869) | 17.5% | 31.6% |
| Gold Circuit Electronics (TWSE:2368) | 31.4% | 37.2% |
| FUNDINNOInc (TSE:462A) | 34.4% | 53.7% |
| Fulin Precision (SZSE:300432) | 10.6% | 55.2% |
Let's explore several standout options from the results in the screener.
JHT DesignLtd (SHSE:603061)
Simply Wall St Growth Rating: ★★★★★☆
Overview: JHT Design Co., Ltd. focuses on the research, development, production, and sale of semiconductor chip testing equipment in China and has a market cap of CN¥10.10 billion.
Operations: JHT Design Co., Ltd. generates its revenue primarily from the research, development, production, and sale of semiconductor chip testing equipment in China.
Insider Ownership: 23.8%
Earnings Growth Forecast: 36.7% p.a.
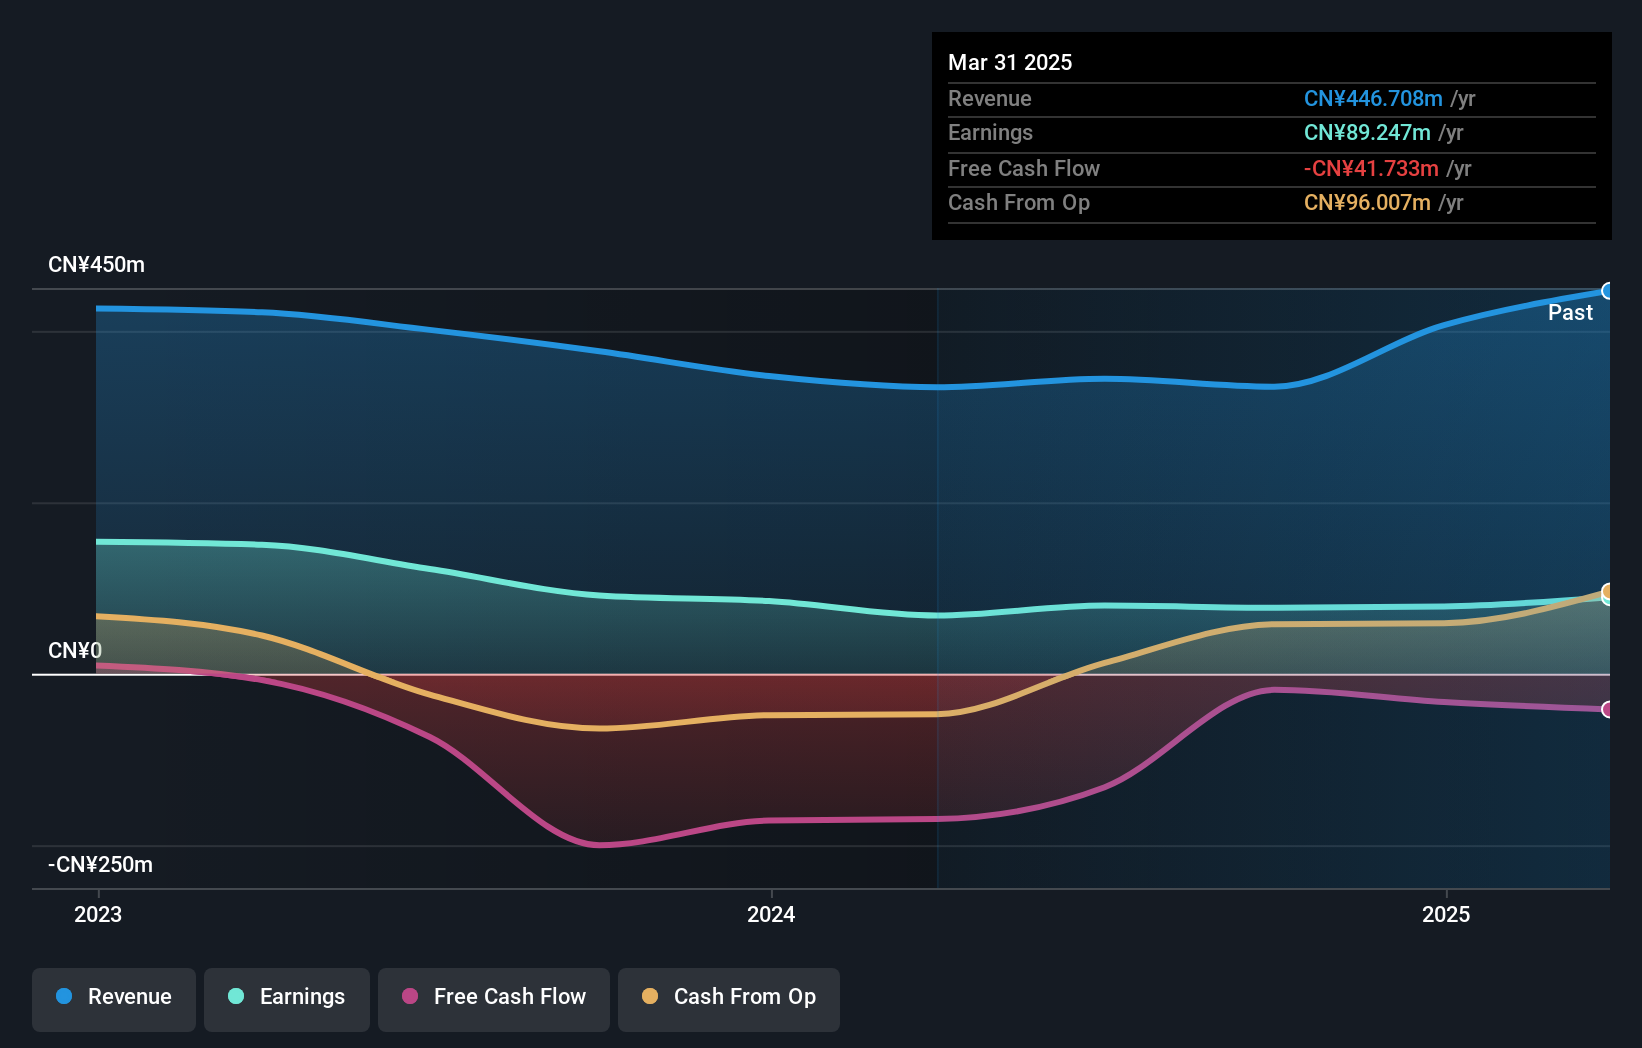
JHT Design Ltd. has demonstrated robust growth, with earnings soaring by 105.9% over the past year and revenue reaching CNY 481.6 million for the nine months ended September 2025. The company’s price-to-earnings ratio of 66.5x is below its industry average, suggesting potential value for investors interested in growth stocks with high insider ownership. However, its highly volatile share price may pose risks despite forecasts indicating significant earnings and revenue growth above market averages in the coming years.
- Dive into the specifics of JHT DesignLtd here with our thorough growth forecast report.
- According our valuation report, there's an indication that JHT DesignLtd's share price might be on the expensive side.
Ningbo Deye Technology Group (SHSE:605117)
Simply Wall St Growth Rating: ★★★★★☆
Overview: Ningbo Deye Technology Group Co., Ltd. specializes in producing and selling heat exchangers, inverters, and dehumidifiers across various international markets, with a market cap of CN¥79.93 billion.
Operations: The company's revenue is derived from the production and sales of heat exchangers, inverters, and dehumidifiers across international markets.
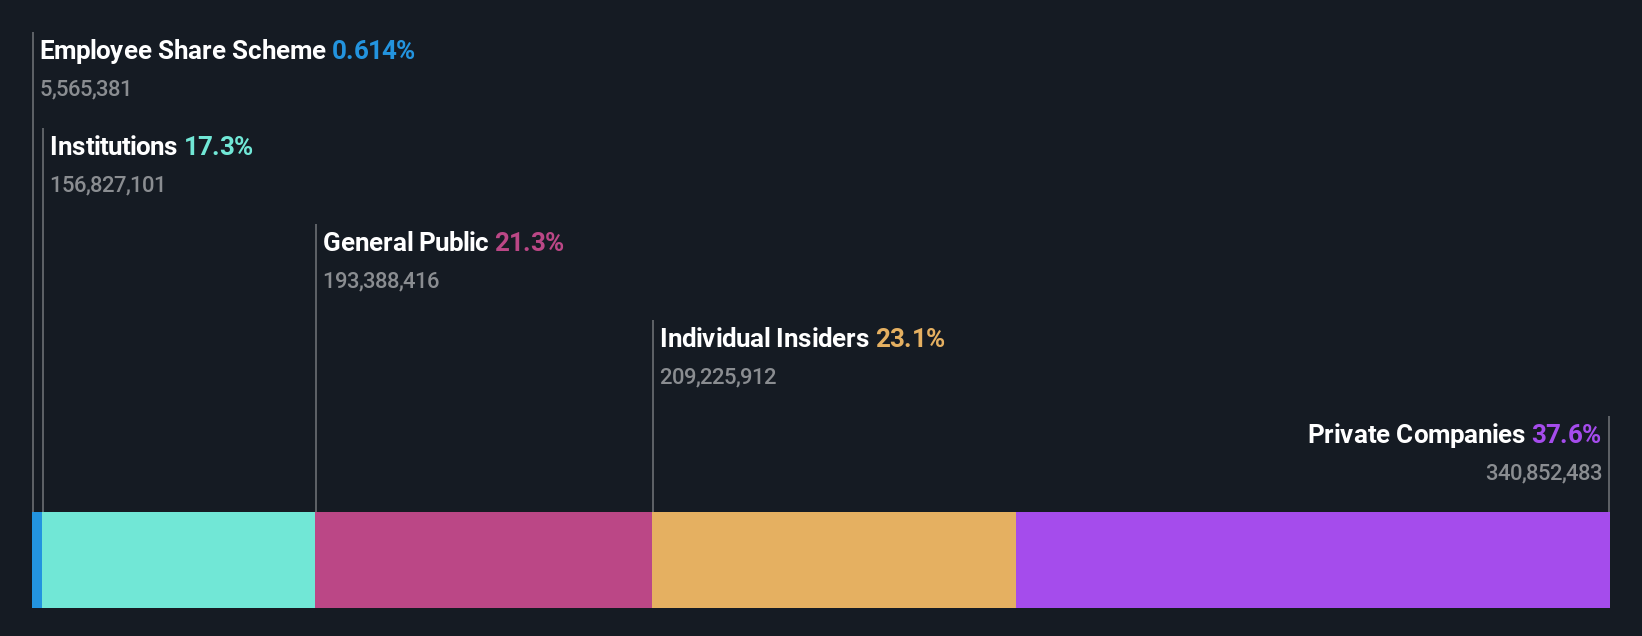
Insider Ownership: 23.1%
Earnings Growth Forecast: 20.5% p.a.
Ningbo Deye Technology Group shows promising growth potential, with revenue forecasted to grow 21.6% annually, outpacing the CN market. Despite a slower earnings growth forecast of 20.5% compared to the market's 27.6%, its price-to-earnings ratio of 26.2x suggests good value relative to peers. Recent financials reported sales of CNY 8.85 billion and net income of CNY 2.35 billion for nine months ending September 2025, reflecting stable profitability amidst high insider ownership levels.
- Take a closer look at Ningbo Deye Technology Group's potential here in our earnings growth report.
- The valuation report we've compiled suggests that Ningbo Deye Technology Group's current price could be quite moderate.
Beijing Relpow Technology (SZSE:300593)
Simply Wall St Growth Rating: ★★★★★☆
Overview: Beijing Relpow Technology Co., Ltd specializes in the manufacturing and sale of power supply products both in China and internationally, with a market cap of CN¥17.75 billion.
Operations: Revenue Segments (in millions of CN¥):
Insider Ownership: 28.5%
Earnings Growth Forecast: 104.8% p.a.
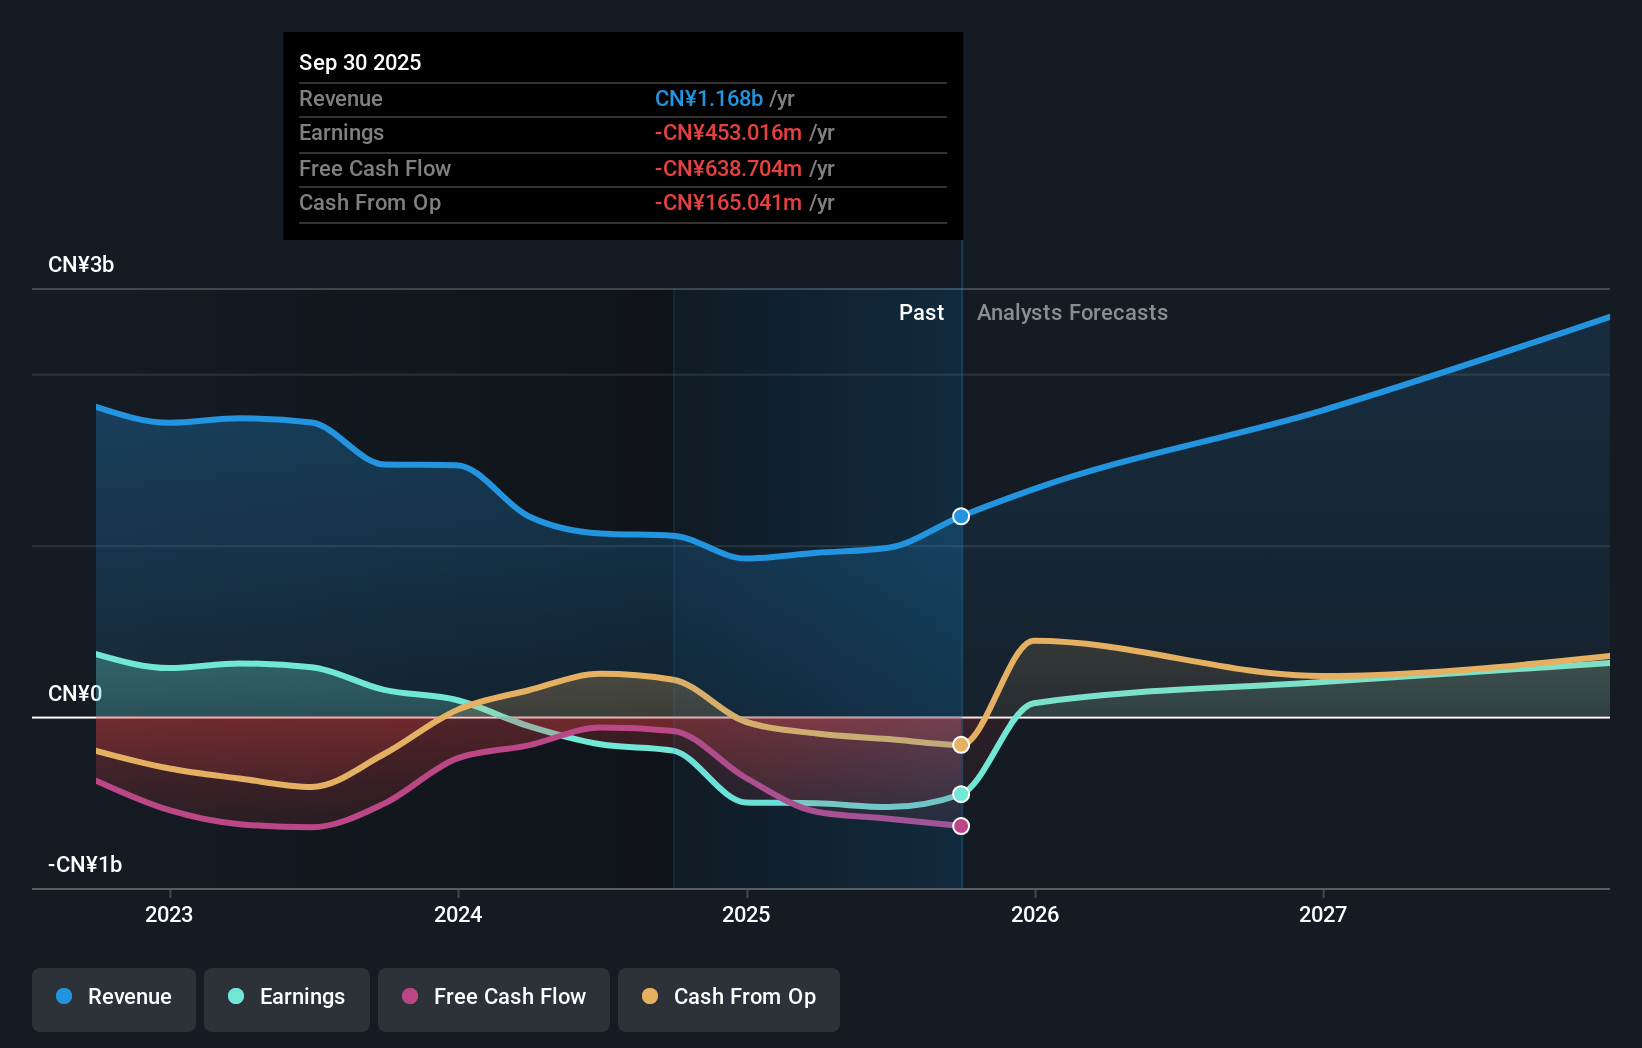
Beijing Relpow Technology is experiencing significant revenue growth, with a reported CNY 928.66 million for the first nine months of 2025, up from CNY 682.02 million the previous year. Despite a net loss of CNY 89.86 million, this marks an improvement from last year's loss of CNY 137.62 million. The company anticipates becoming profitable within three years, with expected annual revenue growth of over 40%, surpassing market averages and reflecting potential for future performance enhancement amidst high insider ownership levels.
- Click here and access our complete growth analysis report to understand the dynamics of Beijing Relpow Technology.
- Our expertly prepared valuation report Beijing Relpow Technology implies its share price may be too high.
Summing It All Up
- Access the full spectrum of 843 Fast Growing Global Companies With High Insider Ownership by clicking on this link.
- Contemplating Other Strategies? Uncover 14 companies that survived and thrived after COVID and have the right ingredients to survive Trump's tariffs.
This article by Simply Wall St is general in nature. We provide commentary based on historical data and analyst forecasts only using an unbiased methodology and our articles are not intended to be financial advice. It does not constitute a recommendation to buy or sell any stock, and does not take account of your objectives, or your financial situation. We aim to bring you long-term focused analysis driven by fundamental data. Note that our analysis may not factor in the latest price-sensitive company announcements or qualitative material. Simply Wall St has no position in any stocks mentioned.The analysis only considers stock directly held by insiders. It does not include indirectly owned stock through other vehicles such as corporate and/or trust entities. All forecast revenue and earnings growth rates quoted are in terms of annualised (per annum) growth rates over 1-3 years.
Have feedback on this article? Concerned about the content? Get in touch with us directly. Alternatively, email editorial-team@simplywallst.com