
- LIVE QUOTES
- LEARN
- HELP
 Nasdaq
 Wall Street Journal
EN
Is Nasdaq (NDAQ) Pricing Leave Room After 30% One-Year Surge?
- If you are wondering whether Nasdaq's share price still reflects good value or if the easy gains are already behind it, the next sections will walk through what the current market price might be implying.
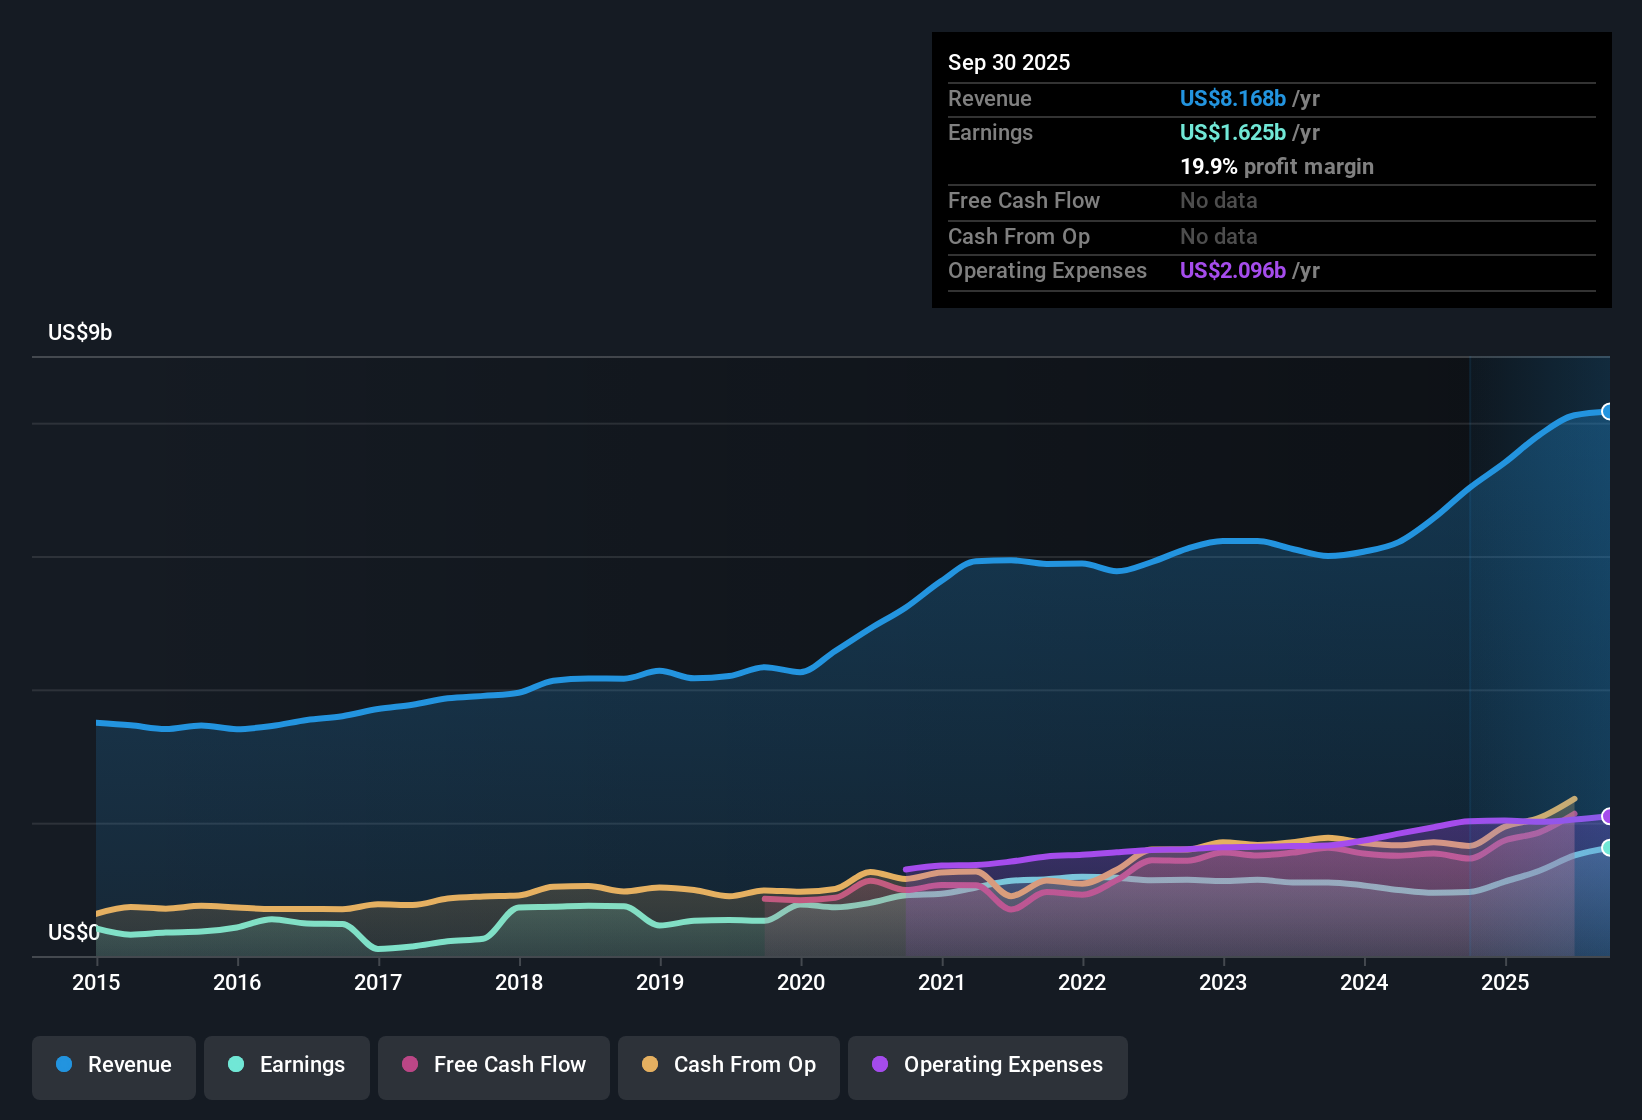
- Nasdaq last closed at US$100.40, with returns of 3.4% over the past week, 11.8% over the past month and 30.3% over the last year. The 3 year and 5 year returns sit at 66.3% and 126.3% respectively.
- Recent attention on the stock has been influenced by ongoing market interest in major index providers and market infrastructure companies, as investors reassess how these businesses fit into their portfolios. This context matters because it shapes how investors think about the risk and return trade off that is reflected in Nasdaq's current share price.
- Right now, Nasdaq scores 0/6 on our valuation checks. We will walk through what different valuation approaches say about that score and then finish with a framework that can help you make more sense of valuation than any single metric on its own.
Nasdaq scores just 0/6 on our valuation checks. See what other red flags we found in the full valuation breakdown.
Approach 1: Nasdaq Excess Returns Analysis
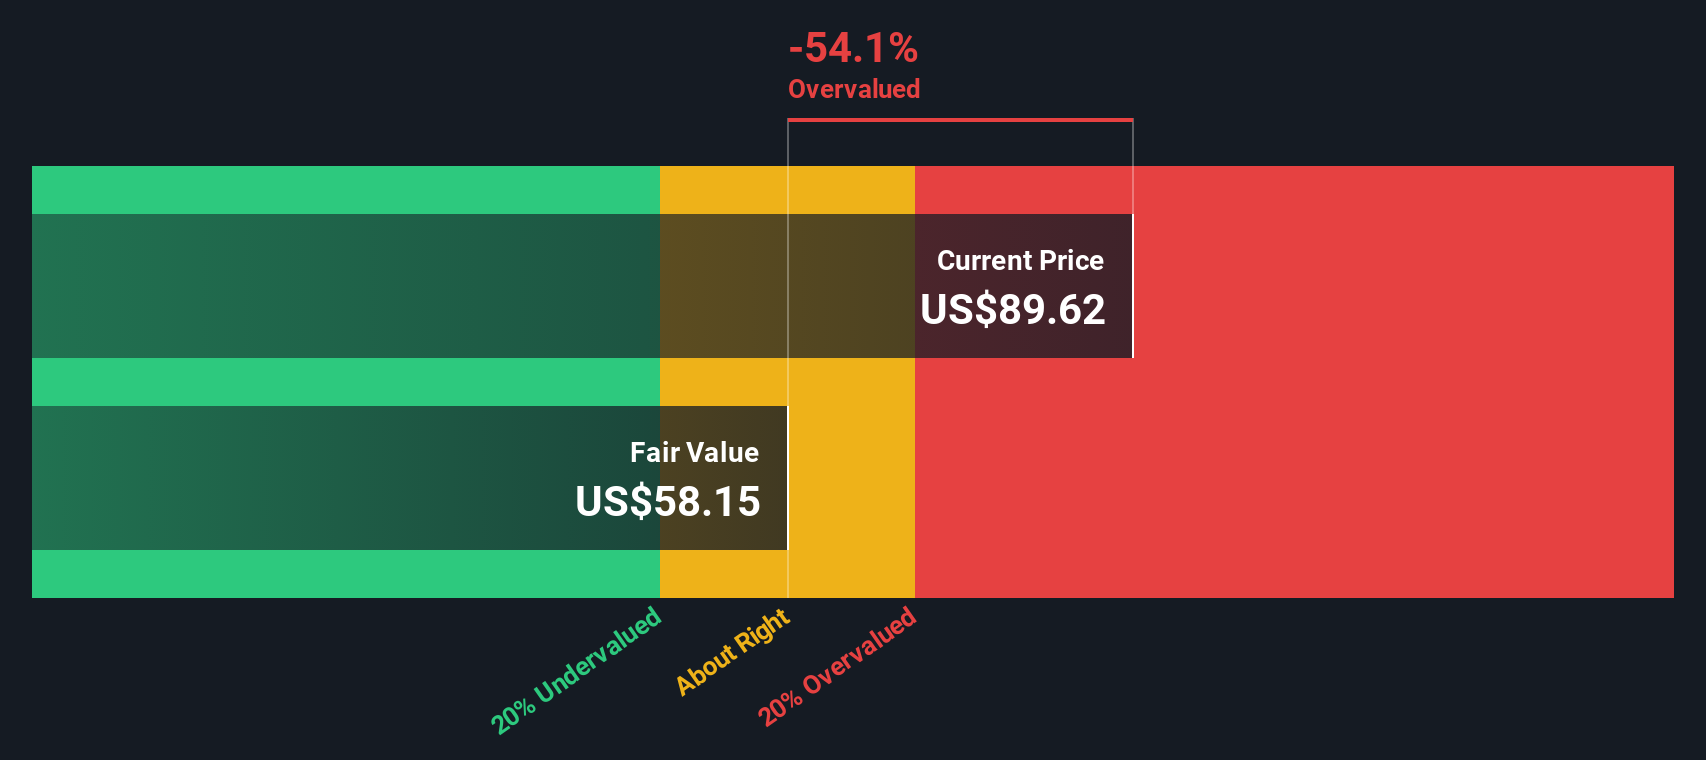
The Excess Returns model looks at whether Nasdaq is earning more on its equity base than it costs the company to fund that equity, then capitalizes that gap into an intrinsic value per share.
On this view, Nasdaq has a Book Value of $20.99 per share and a Stable EPS estimate of $2.45 per share, based on the median return on equity from the past 5 years. The Cost of Equity is $2.02 per share, which implies an Excess Return of $0.43 per share. That excess is built on an average Return on Equity of 10.30% and a Stable Book Value estimate of $23.81 per share, using weighted future book value estimates from 3 analysts.
When these excess returns are projected and discounted, the model arrives at an intrinsic value of about $31.96 per share. Compared with the recent share price of US$100.40, this framework suggests the stock is around 214.2% above the model estimate. On this metric, Nasdaq screens as expensive rather than cheap.
Result: OVERVALUED
Our Excess Returns analysis suggests Nasdaq may be overvalued by 214.2%. Discover 885 undervalued stocks or create your own screener to find better value opportunities.
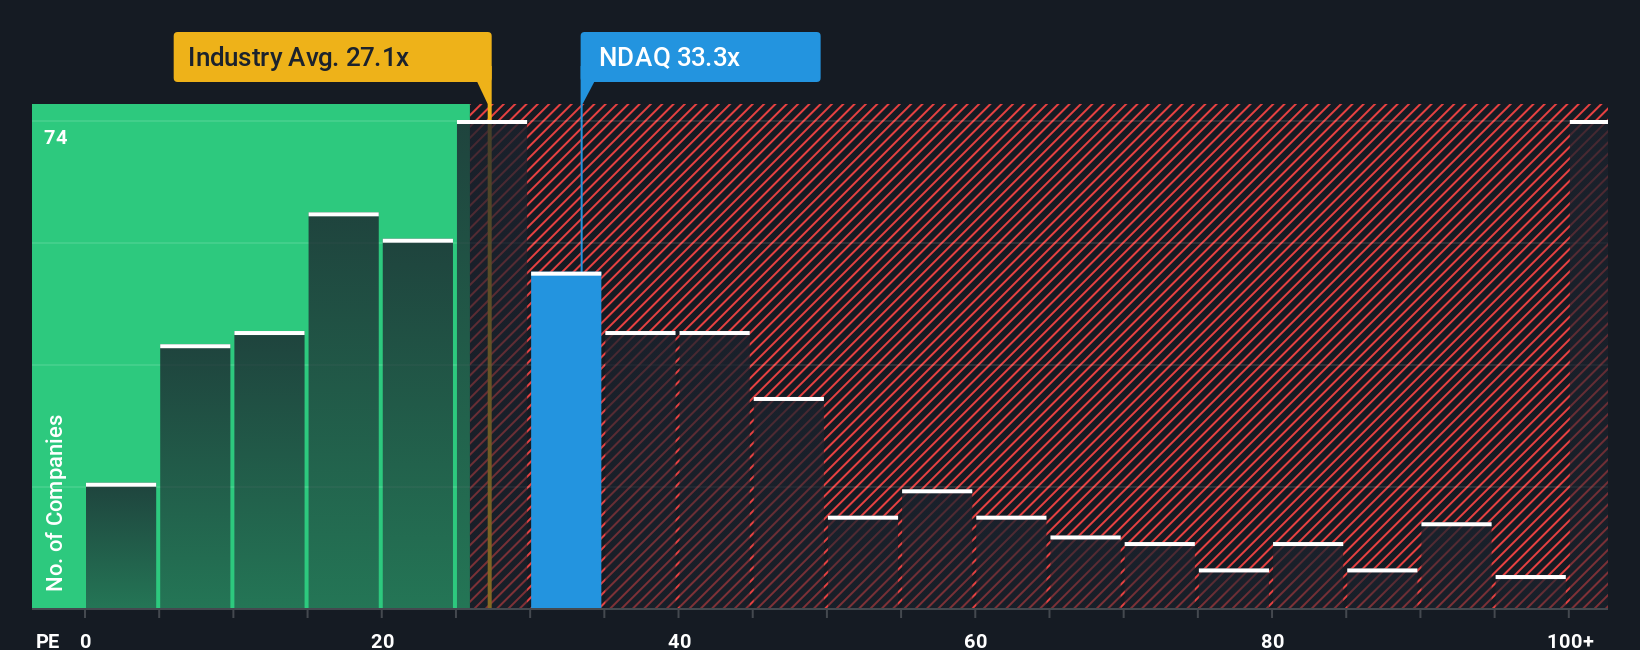
Approach 2: Nasdaq Price vs Earnings
For a consistently profitable company like Nasdaq, the P/E ratio is a useful way to gauge how much you are paying for each dollar of earnings. It ties the share price directly to the bottom line, which is what ultimately matters for equity holders.
What counts as a "normal" P/E depends a lot on what the market expects for future growth and how risky those earnings are. Higher expected growth or lower perceived risk can justify a higher P/E, while lower growth or higher risk usually points to a lower, more cautious multiple.
Nasdaq currently trades on a P/E of 35.28x, compared with the Capital Markets industry average of 25.75x and a peer group average of 31.90x. Simply Wall St’s Fair Ratio framework goes a step further, estimating what a P/E might look like after considering factors such as earnings growth, profit margins, risk profile, industry, and market cap. For Nasdaq, the Fair Ratio is 16.70x, which is well below the current 35.28x. On this view, the stock screens as expensive rather than aligned with its fundamentals.
Result: OVERVALUED
P/E ratios tell one story, but what if the real opportunity lies elsewhere? Discover 1449 companies where insiders are betting big on explosive growth.
Upgrade Your Decision Making: Choose your Nasdaq Narrative
Earlier we mentioned that there is an even better way to understand valuation. On Simply Wall St you can use Narratives, where you write a clear story for Nasdaq that links your view on its business, forecasts for future revenue, earnings and margins, and your own fair value. The platform, used by millions of investors within the Community page, then keeps that Narrative updated as new news or earnings arrive and shows you in real time whether your fair value (which might be closer to the most bullish US$115 or the more cautious US$74 in the current analyst range around the US$104 consensus) sits above or below the live share price so you can decide if the stock looks like a buy, a hold, or a sell for you.
Do you think there's more to the story for Nasdaq? Head over to our Community to see what others are saying!
This article by Simply Wall St is general in nature. We provide commentary based on historical data and analyst forecasts only using an unbiased methodology and our articles are not intended to be financial advice. It does not constitute a recommendation to buy or sell any stock, and does not take account of your objectives, or your financial situation. We aim to bring you long-term focused analysis driven by fundamental data. Note that our analysis may not factor in the latest price-sensitive company announcements or qualitative material. Simply Wall St has no position in any stocks mentioned.
Have feedback on this article? Concerned about the content? Get in touch with us directly. Alternatively, email editorial-team@simplywallst.com