
- LIVE QUOTES
- LEARN
- HELP
 Nasdaq
 Wall Street Journal
EN
Has Flagstar Bank (FLG) Already Reflected Its Recent 1-Year Rally In The Share Price
- Wondering if Flagstar Bank National Association at US$12.55 offers good value today, or if the recent run has already priced in the key positives?
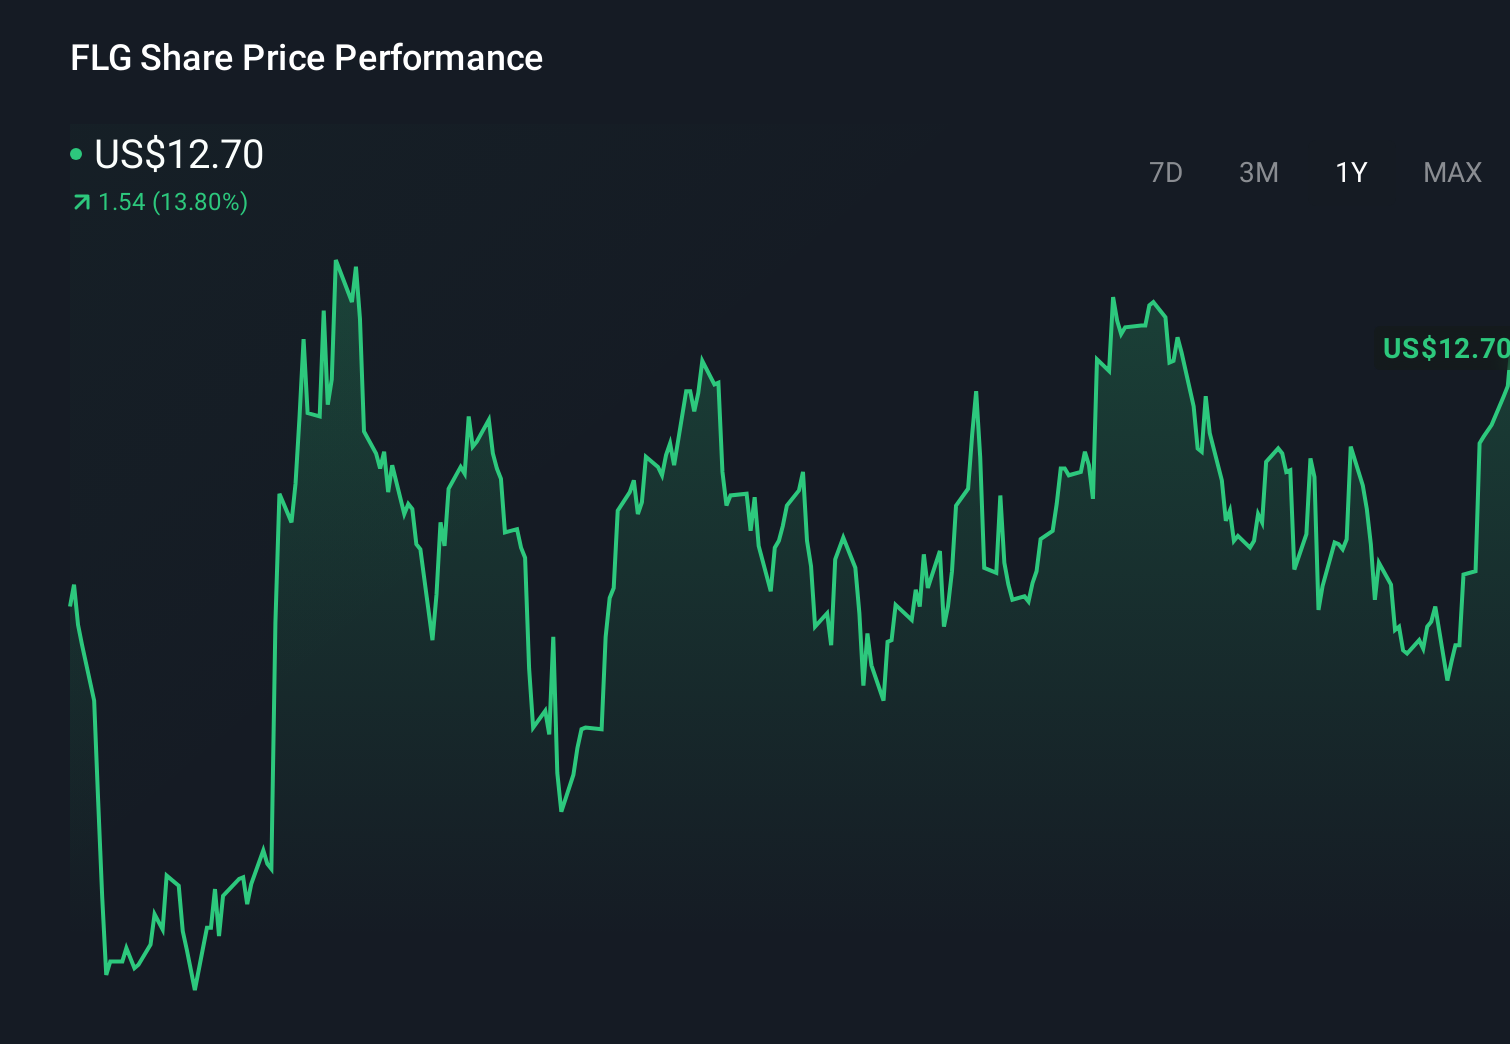
- The stock has been fairly flat year to date at 0.0%, but that sits alongside a 38.1% return over the last year and longer term moves of a 51.1% decline over three years and a 52.9% decline over five years.
- Recent coverage has focused on Flagstar's position as a regional banking name and how investors are reassessing risk across the sector. This helps frame those mixed return figures. Broader discussions around bank balance sheets and funding costs have also influenced sentiment toward stocks like Flagstar, providing extra context to its share price path.
- Right now, Flagstar scores 2 out of 6 on our valuation checks. We will walk through what different valuation methods suggest and then finish with a more complete way to think about what the stock could be worth.
Flagstar Bank National Association scores just 2/6 on our valuation checks. See what other red flags we found in the full valuation breakdown.
Approach 1: Flagstar Bank National Association Excess Returns Analysis
The Excess Returns model looks at whether Flagstar Bank National Association is earning more on its equity base than it costs to fund that equity. Instead of focusing on cash flows, it compares the return on equity to the cost of equity and then builds an intrinsic value per share from those excess returns.
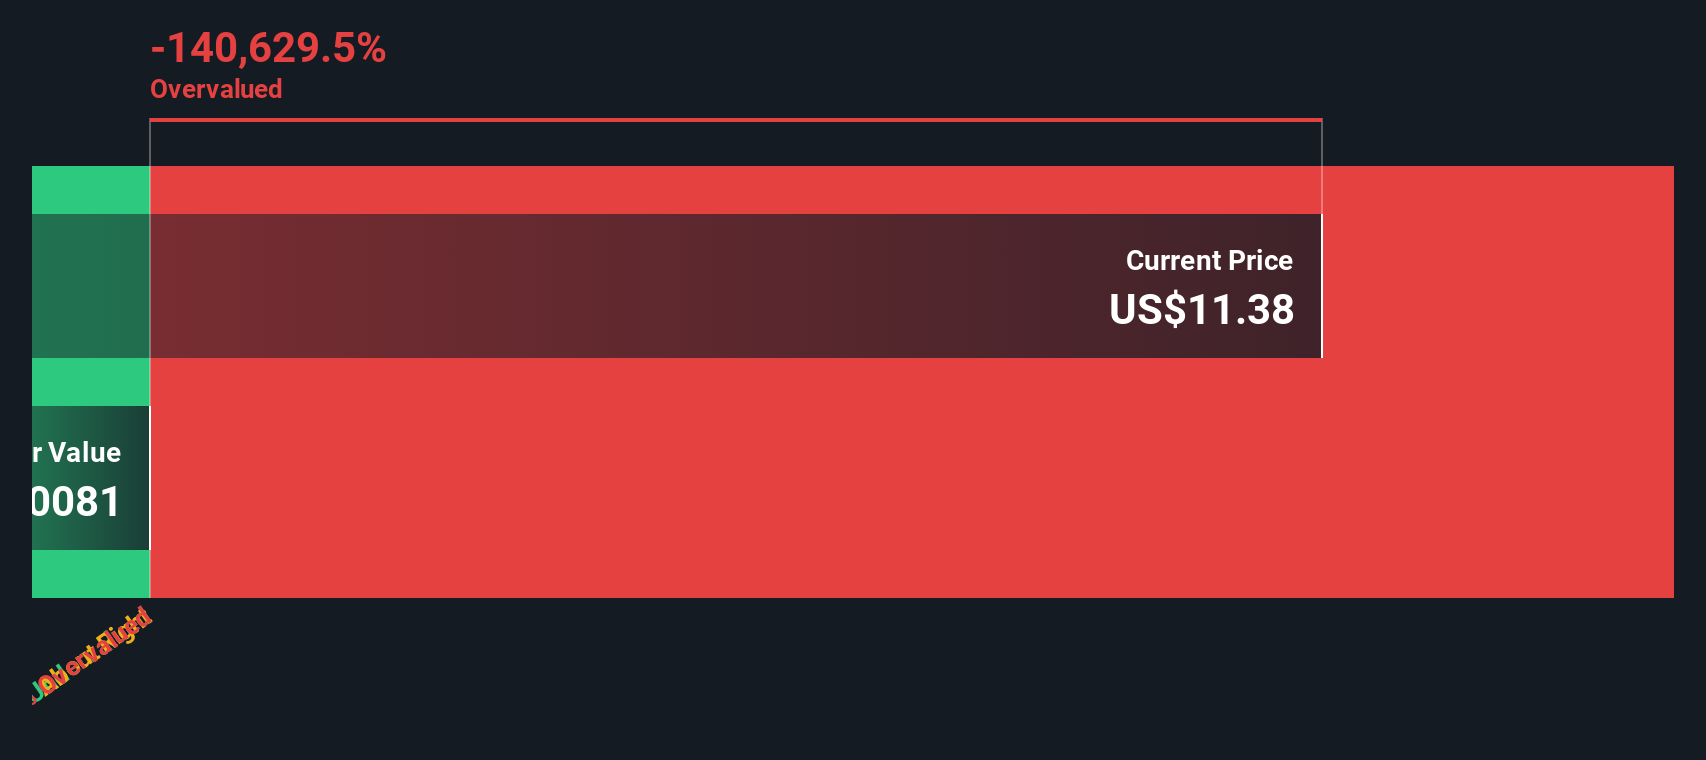
For Flagstar, the model uses a Book Value of US$18.30 per share and a Stable EPS of US$1.20 per share, based on weighted future Return on Equity estimates from 10 analysts. The Average Return on Equity input is 6.50%. Against this, the Cost of Equity is US$1.51 per share, which leads to an Excess Return of a US$0.31 per share loss in the model. The Stable Book Value is set at US$18.52 per share, also sourced from weighted future Book Value estimates from 10 analysts.
Using these assumptions together, the Excess Returns model arrives at an intrinsic value of about US$12.24 per share. This implies the stock is roughly 2.5% overvalued compared with the current price of US$12.55. That is a very small gap, so the model views the shares as broadly in line with their estimated worth.
Result: ABOUT RIGHT
Flagstar Bank National Association is fairly valued according to our Excess Returns, but this can change at a moment's notice. Track the value in your watchlist or portfolio and be alerted on when to act.
Approach 2: Flagstar Bank National Association Price vs Book
For banks, the price to book, or P/B, ratio is often the cleanest yardstick because the balance sheet is central to how the business works. You are essentially comparing what the market is paying for each US$1 of net assets on the books.
In general, higher expected growth and lower perceived risk tend to support a higher "normal" valuation multiple. Slower growth or higher risk often align with a lower multiple. That idea also applies to P/B, not just P/E.
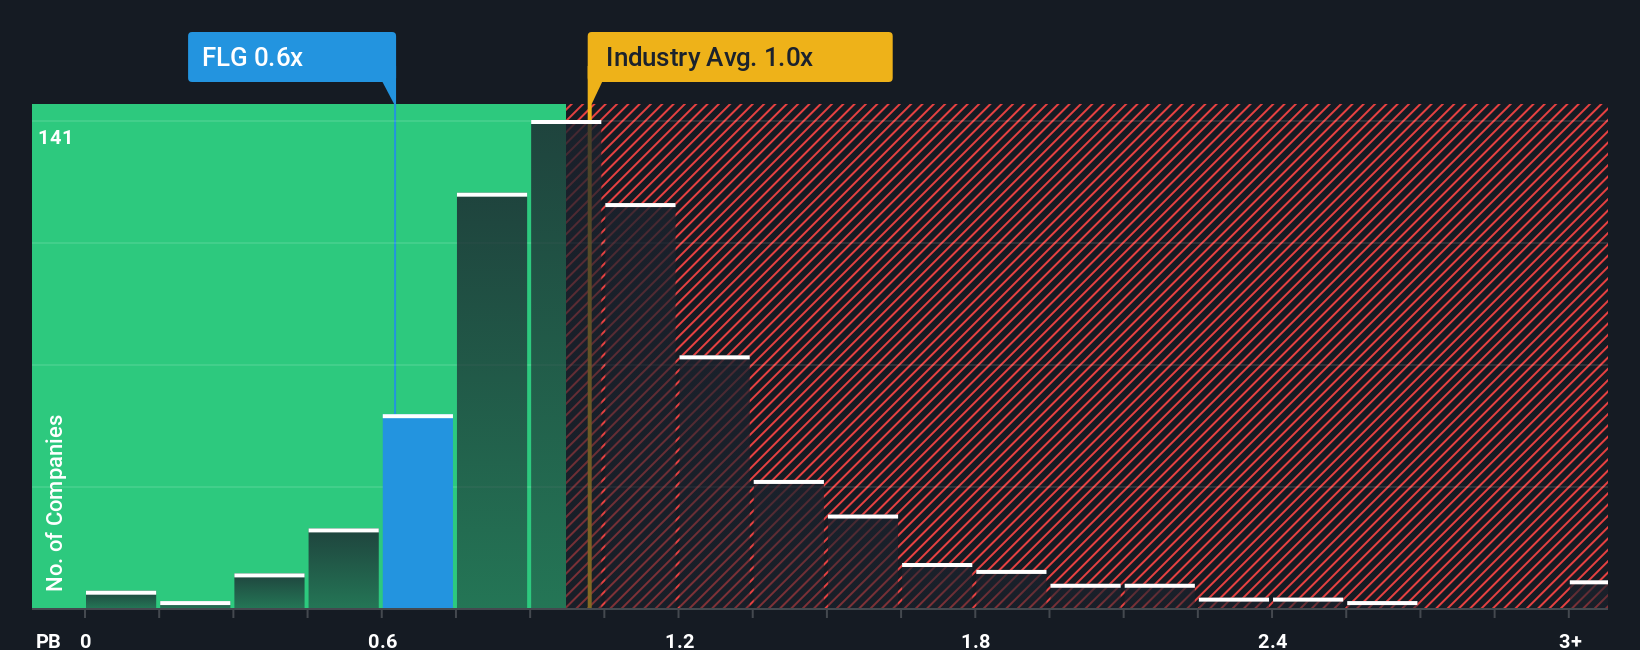
Flagstar currently trades on a P/B of 0.69x, which sits below the Banks industry average of about 1.07x and also below its peer group average of around 1.31x. Simply Wall St’s Fair Ratio is a proprietary estimate of what P/B might be reasonable for Flagstar, taking into account factors such as its earnings profile, profit margins, industry, market cap and company specific risks.
This Fair Ratio can be more informative than a simple comparison with peers or the broad industry, because it adjusts for company specific characteristics rather than assuming one multiple fits all. At this stage, there is no Fair Ratio figure available for Flagstar, so we cannot draw a firm conclusion on whether the shares look overvalued or undervalued relative to that framework.
Result: ABOUT RIGHT
P/B ratios tell one story, but what if the real opportunity lies elsewhere? Discover 1450 companies where insiders are betting big on explosive growth.
Upgrade Your Decision Making: Choose your Flagstar Bank National Association Narrative
Earlier we mentioned that there is an even better way to understand valuation. Let us introduce you to Narratives, which are simply your story about a company, linked to your assumptions for its future revenue, earnings, margins and fair value.
On Simply Wall St, Narratives live in the Community page and give you an easy way to connect Flagstar’s business story to a forecast and then to a fair value that you can compare directly to today’s share price to help decide whether it suits you to buy, hold or sell.
Because Narratives on the platform are updated when new information such as earnings releases or major news appears, your view of Flagstar’s fair value can stay aligned with the latest data without you rebuilding a full model each time.
For example, one Flagstar Narrative might see modest revenue growth and steady margins supporting a fair value close to US$12.24. Another Narrative might assume more conservative earnings and a wider margin of safety, leading to a much lower fair value and a very different conclusion about what to do at US$12.55.
Do you think there's more to the story for Flagstar Bank National Association? Head over to our Community to see what others are saying!
This article by Simply Wall St is general in nature. We provide commentary based on historical data and analyst forecasts only using an unbiased methodology and our articles are not intended to be financial advice. It does not constitute a recommendation to buy or sell any stock, and does not take account of your objectives, or your financial situation. We aim to bring you long-term focused analysis driven by fundamental data. Note that our analysis may not factor in the latest price-sensitive company announcements or qualitative material. Simply Wall St has no position in any stocks mentioned.
Have feedback on this article? Concerned about the content? Get in touch with us directly. Alternatively, email editorial-team@simplywallst.com