
- LIVE QUOTES
- LEARN
- HELP
 Nasdaq
 Wall Street Journal
EN
Is Fastly (FSLY) Pricing Fair After A 5-Year 88% Share Price Decline
- If you are wondering whether Fastly's current share price lines up with its underlying worth, or if the market is missing something, this article is for you.
- Fastly shares last closed at US$10.53, with returns of 3.4% over 7 days, a 5.3% decline over 30 days, 3.3% year to date, 11.8% over 1 year, 13.7% over 3 years and an 88.4% decline over 5 years.
- Recent coverage of Fastly has focused on how investors are reassessing content delivery and edge computing providers as the sector matures and competition stays intense. This shift in attention helps frame Fastly's recent returns and where sentiment currently sits.
- On our checks, Fastly scores just 1 out of 6 for potential undervaluation. We will look at different valuation approaches next, and then finish with a way of thinking about value that can give you an even clearer picture.
Fastly scores just 1/6 on our valuation checks. See what other red flags we found in the full valuation breakdown.
Approach 1: Fastly Discounted Cash Flow (DCF) Analysis
A Discounted Cash Flow, or DCF, model estimates what a company might be worth by projecting its future cash flows and discounting them back to today using a required return. It is essentially asking what all future cash generated by the business is worth in present dollar terms.
For Fastly, the model used is a 2 Stage Free Cash Flow to Equity approach. The latest twelve month Free Cash Flow is about $31.3 million. Analyst inputs and Simply Wall St extrapolations project Free Cash Flow rising to $37.7 million in 2026, $44.4 million in 2027 and around $73.3 million by 2035, all in $ terms. Each of those future cash flows is discounted back, then summed to arrive at an estimated intrinsic value per share.
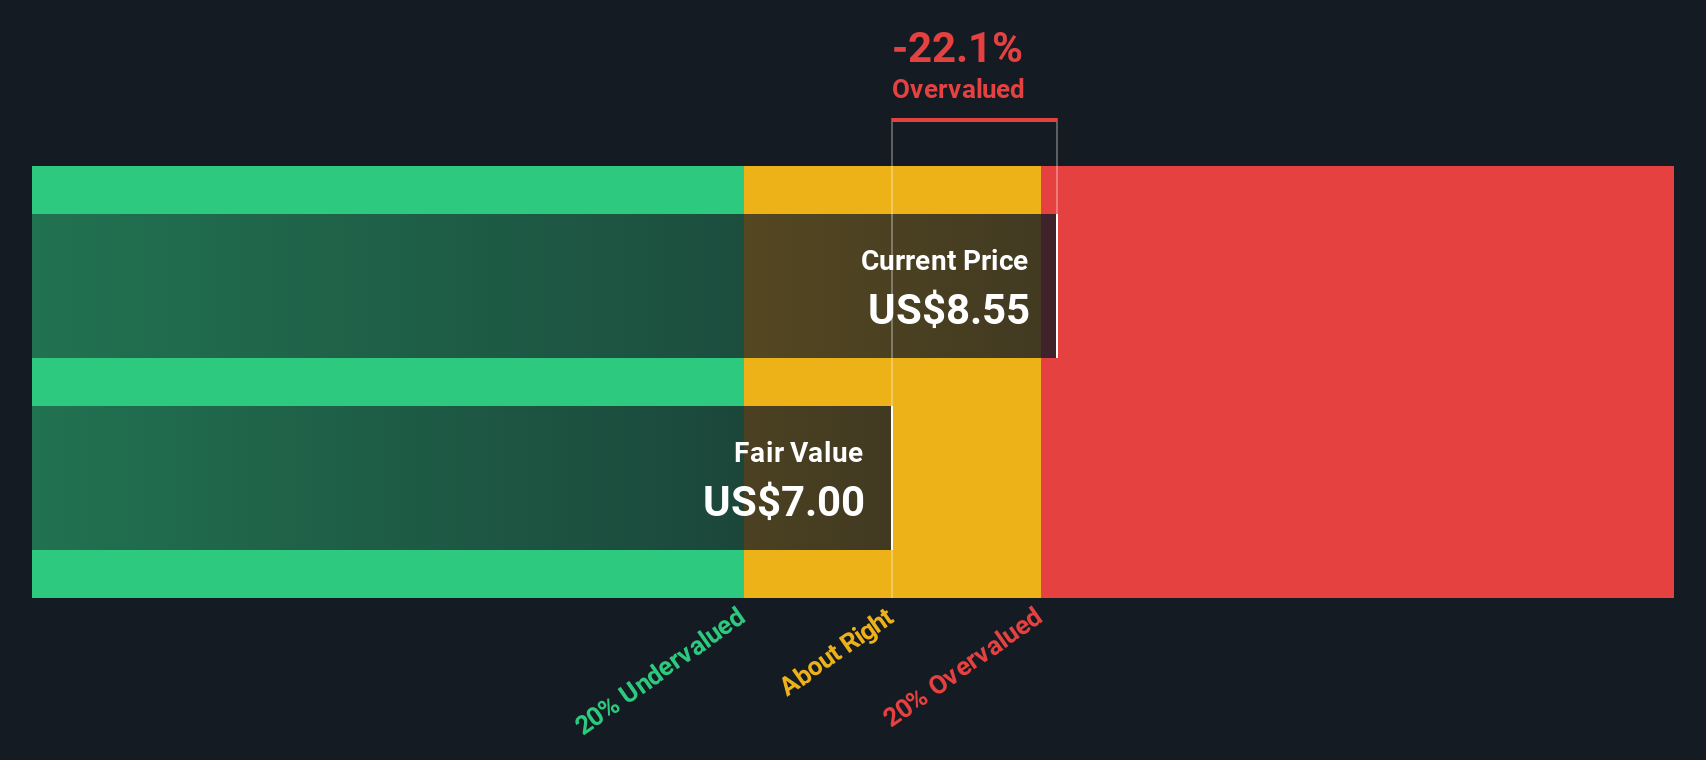
On this basis, the DCF fair value for Fastly is calculated at about $5.28 per share. Compared with the recent share price of $10.53, the model implies the stock is 99.5% overvalued, so the cash flow assumptions used here do not currently support the market price.
Result: OVERVALUED
Our Discounted Cash Flow (DCF) analysis suggests Fastly may be overvalued by 99.5%. Discover 885 undervalued stocks or create your own screener to find better value opportunities.
Approach 2: Fastly Price vs Sales
For companies where earnings are limited or volatile, the P/S ratio is often a useful way to think about value because it compares what you pay to the revenue the business is already generating.
What counts as a “normal” P/S depends a lot on how quickly investors expect that revenue to grow and how risky they think the business is. Higher growth and lower perceived risk tend to support higher multiples, while slower growth or higher uncertainty typically point to lower ones.
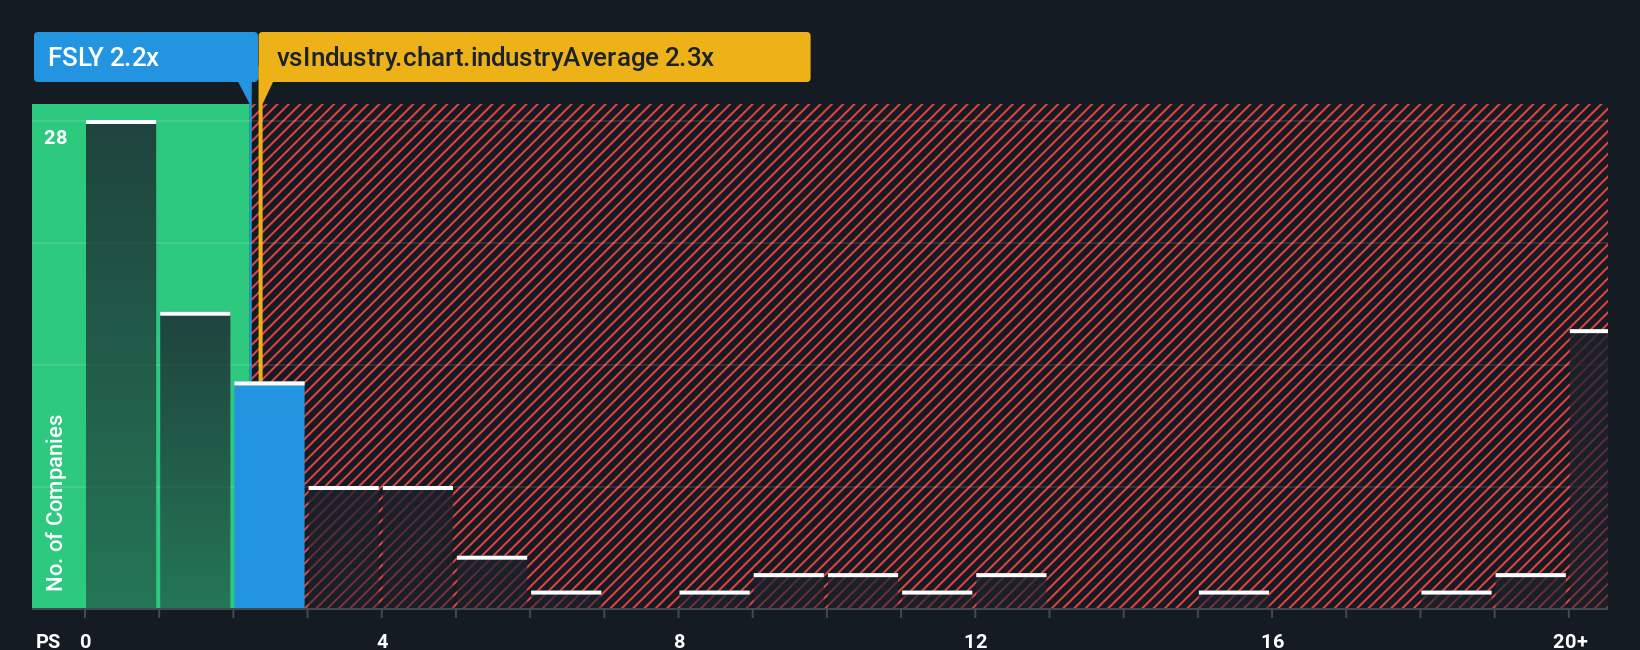
Fastly currently trades on a P/S of 2.66x. That sits above the IT industry average P/S of 2.37x and below a peer group average of 3.19x. Simply Wall St’s Fair Ratio for Fastly is 2.62x. This is its proprietary estimate of what the P/S should be once you factor in elements like earnings growth, margins, the company’s industry, market cap and risk profile. This tailored Fair Ratio can often be more informative than a simple comparison to peers or the broad industry, because it adjusts for Fastly’s own characteristics rather than assuming it should match a generic average.
With the current P/S at 2.66x and the Fair Ratio at 2.62x, the valuation looks very close to that custom estimate.
Result: ABOUT RIGHT
P/S ratios tell one story, but what if the real opportunity lies elsewhere? Discover 1450 companies where insiders are betting big on explosive growth.
Upgrade Your Decision Making: Choose your Fastly Narrative
Earlier we mentioned that there is an even better way to understand valuation. Narratives on Simply Wall St let you attach a clear story about Fastly to your own numbers by linking what you think will happen to its revenue, earnings and margins to a forecast, a fair value, and then a simple comparison of that fair value to today’s price. All of this is available inside an easy tool on the Community page that updates when fresh news or earnings arrive, so you can continuously test your view, whether you side closer to the most bullish analyst price target of US$10.00, the most cautious target of US$6.00, or anywhere in between.
Do you think there's more to the story for Fastly? Head over to our Community to see what others are saying!

This article by Simply Wall St is general in nature. We provide commentary based on historical data and analyst forecasts only using an unbiased methodology and our articles are not intended to be financial advice. It does not constitute a recommendation to buy or sell any stock, and does not take account of your objectives, or your financial situation. We aim to bring you long-term focused analysis driven by fundamental data. Note that our analysis may not factor in the latest price-sensitive company announcements or qualitative material. Simply Wall St has no position in any stocks mentioned.
Have feedback on this article? Concerned about the content? Get in touch with us directly. Alternatively, email editorial-team@simplywallst.com